Visualizing All the Money in the World in One Infographic

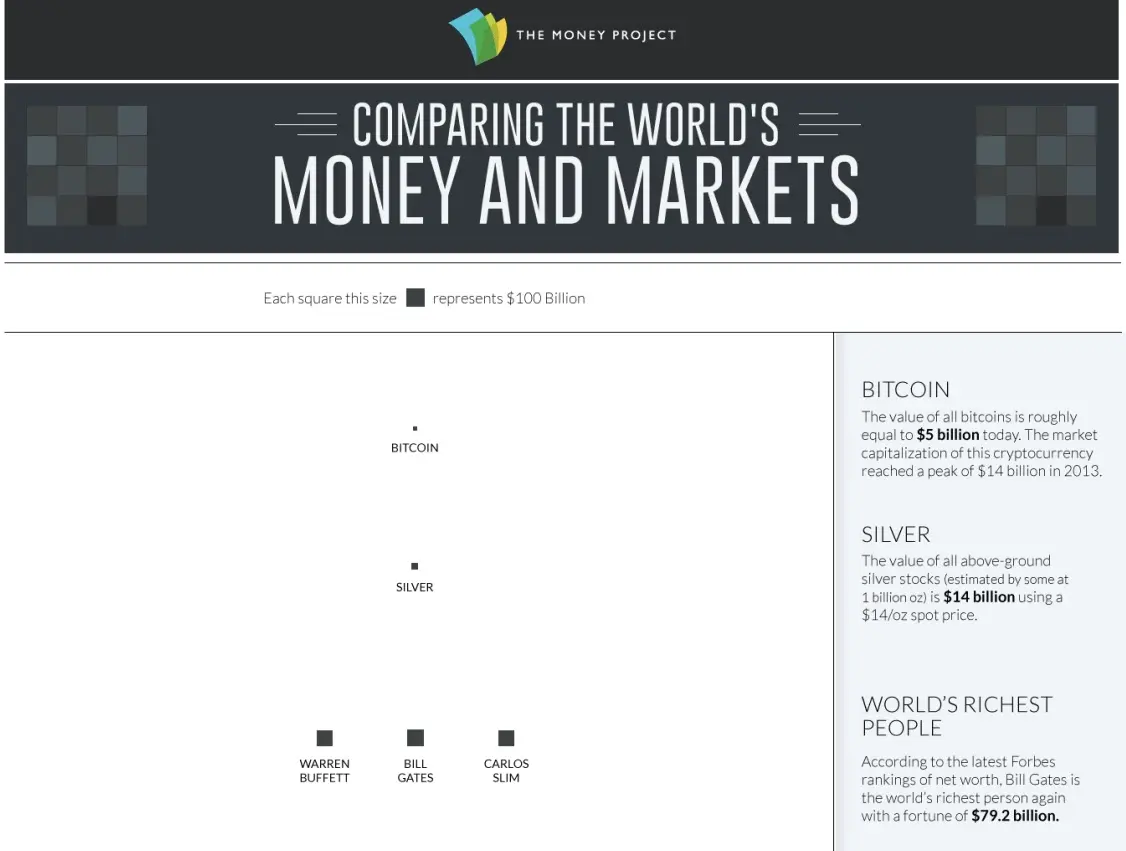
From the value of all the Bitcoins in the world ($5 billion) to the amount of total global debt ($199 trillion) to the barely-fathomable amount of the derivatives market (as much as $1.2 quadrillion. Yup. Quadrillion), a chart created by The Money Project, produced by Visual Capitalist, attempts to put all the world’s currency in one place in the form of tiny, little squares (h/t Fast Co. Exist). Starting with the question, “How much money exists in the world?” this data visualization starts with the world’s total money supply.
According to Visual Capitalist president Jeff Desjardins, “…the amount of money that exists changes depending on how we define it. The more abstract definition of money we use, the higher the number is.” In addition to looking at the different definitions of money in comparison, the chart’s creators want to put it all in context (hence the presence of familiar benchmarks like the net worth of top billionaires and the value of all stock markets).
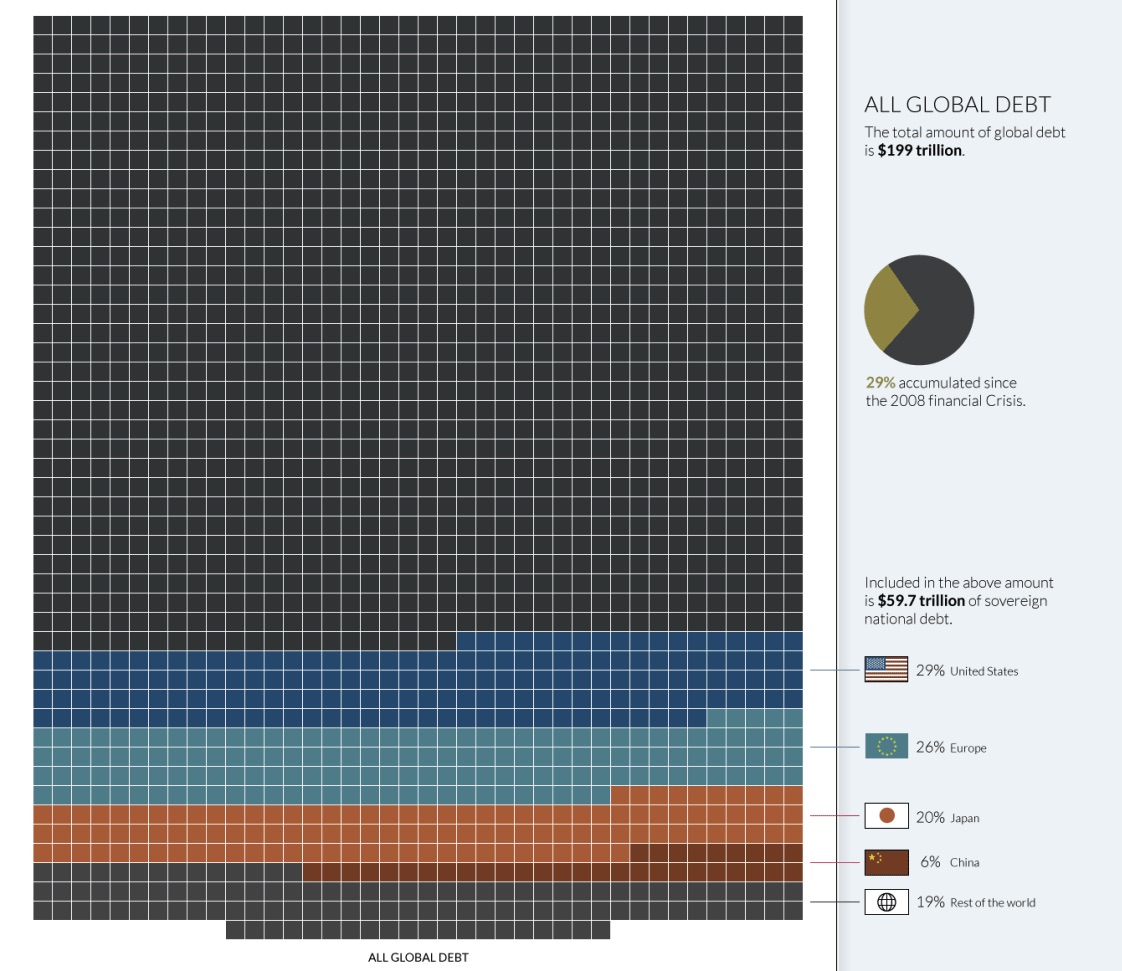
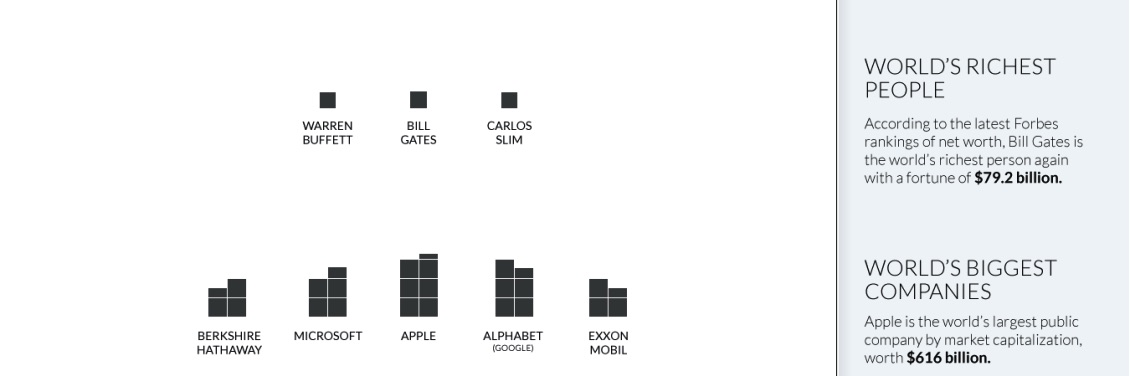
Billionaires like Warren Buffett and Carlos Slim are represented by squares that show their net worth (which looks uncharacteristically puny in comparison to, say, the commercial real estate market), but these massive markets are all dwarfed by the amount of global debt.
The most impressive number of all represents the value of all derivative contracts (futures contracts, options, warrants and swaps, for example), the size and scope of which is $630 trillion at the low end of the estimate, and as much as $1.2 quadrillion (that’s $1,200,000,000,000,000, in case you were wondering). The idea of derivates is hard enough to get one’s head around, as they are, according to the chart’s creator, “mostly traded by people at hedge funds or investment banks, not individual investors…basically, they always get their value from something else, like an option to buy stock or a futures contract for a commodity like corn.” The massively influential derivatives market played a huge role in the last financial crisis, which puts its influence in yet another important perspective. Explore this and the rest of the full infographic here:

[Via Fast Co. Exist]
All figures are in the equivalent of US dollars; Infographic courtesy of The Money Project
RELATED: