MAP: Watch 1 million+ NYC buildings being constructed since 1880

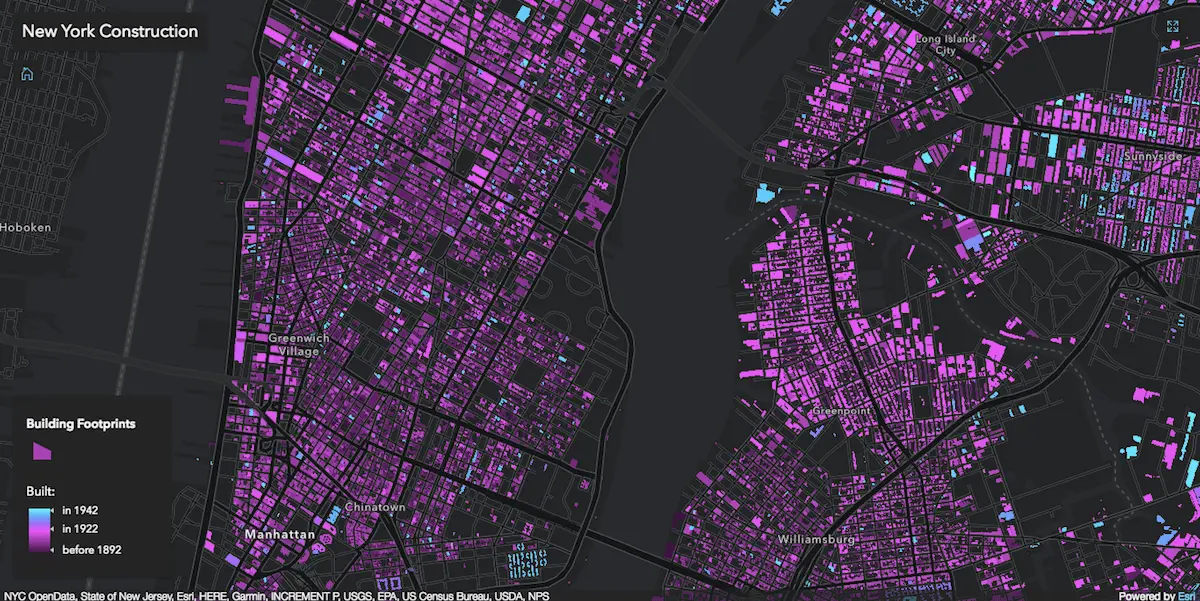
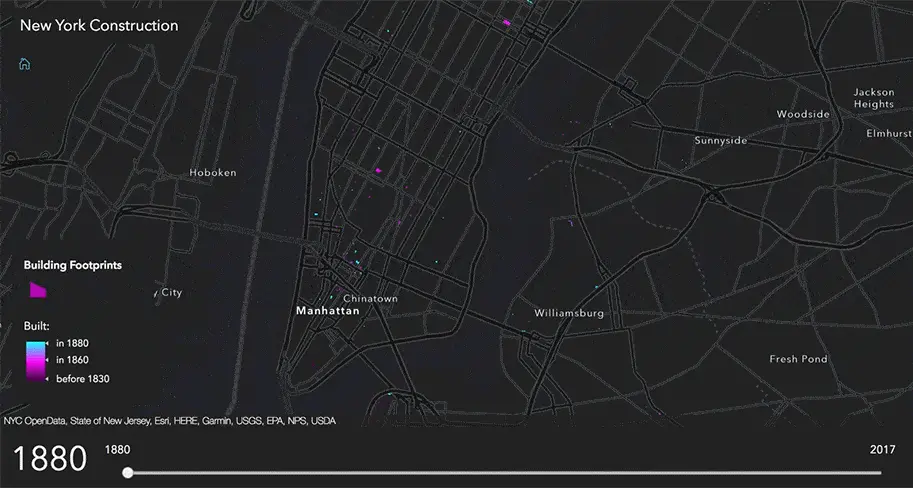
A walk down any block in today’s New York City feels like taking a tour of a giant, noisy, scaffolded construction site. But the map mavens at Esri show us that this is definitely not the only time in history when living in the city felt like occupying a giant beaver colony. Their fascinating New York construction map brings new life to the word “built environment” with time lapse coverage of over a million buildings being built in NYC starting in 1880.
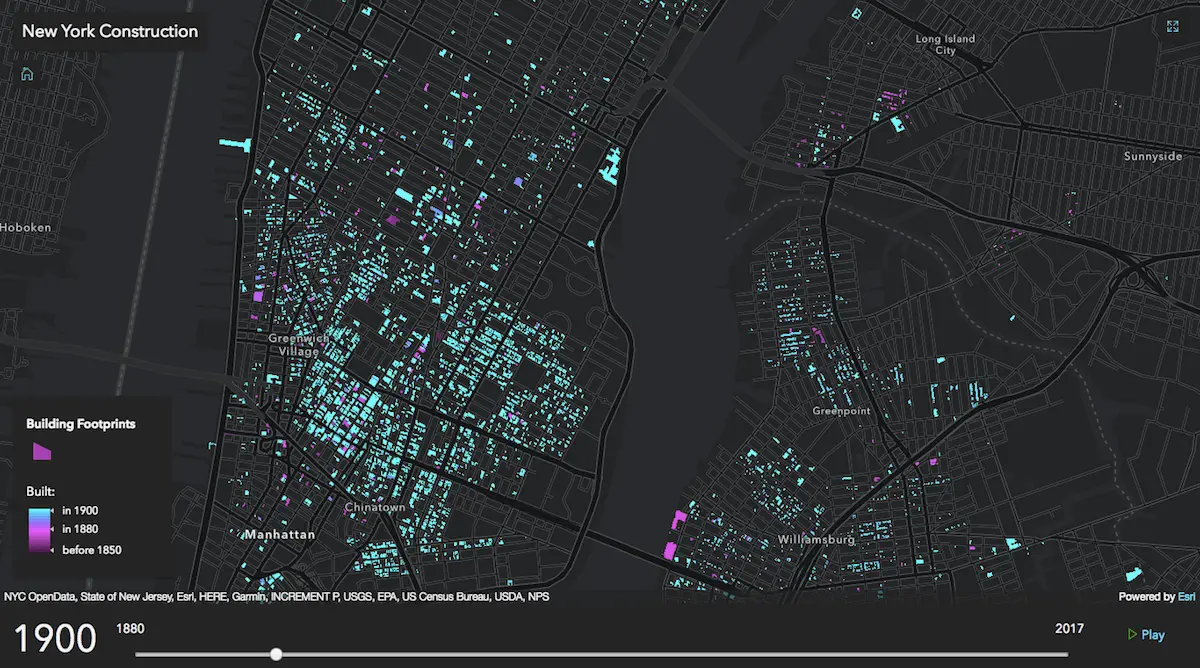
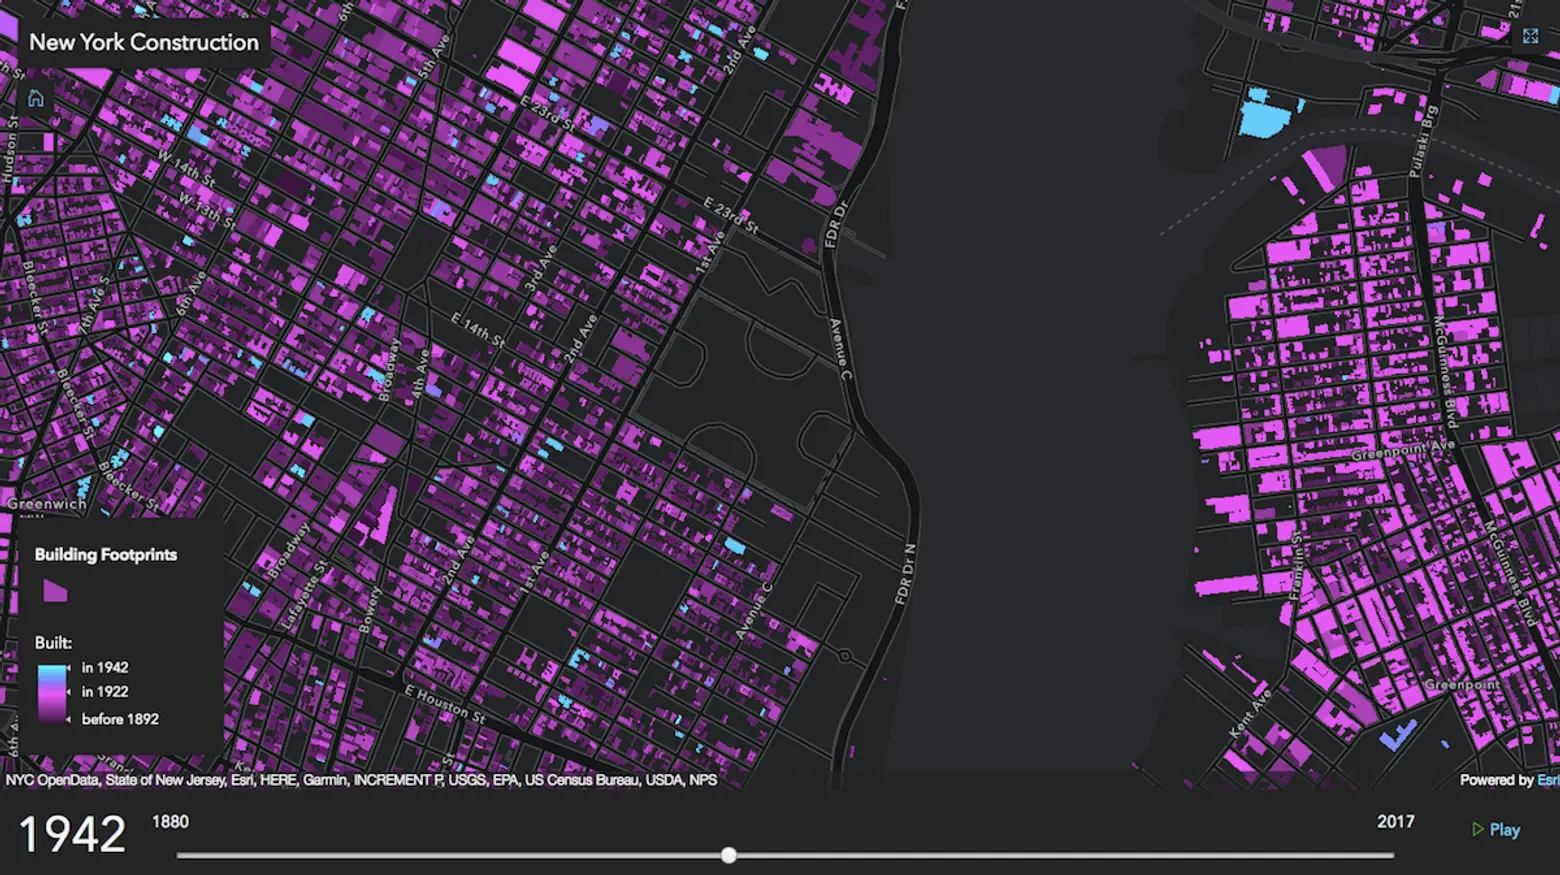
 Lower Manhattan sees a building boom in 1900.
The map illustrates the construction years of more than one million buildings; you can use the slider on the left to see which ones were constructed relative to a specified year. A color variable is used to visualize each building based on its construction year, relative to the slider value. For example, if 1984 is selected, buildings built in 1984 are shown in light blue; buildings built prior to that year are progressively shaded along a blue to pink spectrum according to the year of construction. Those built 20+ years prior to the selected year are shown in pink. Above, Lower Manhattan saw a huge number of buildings rise in 1900.
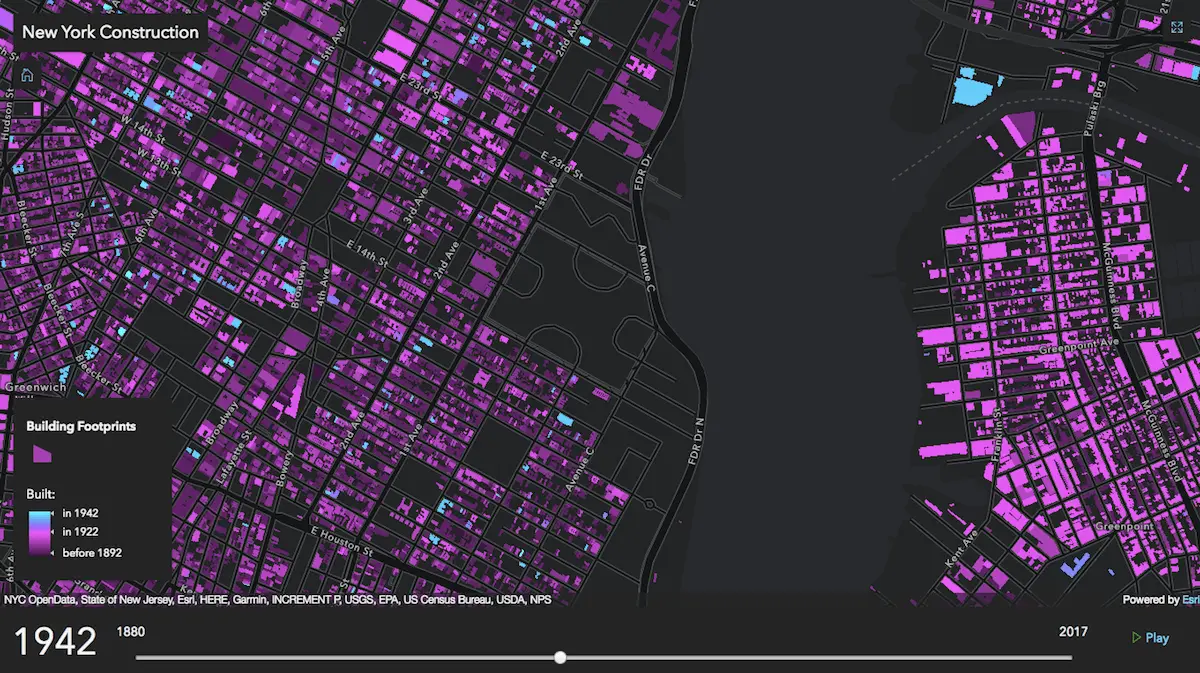
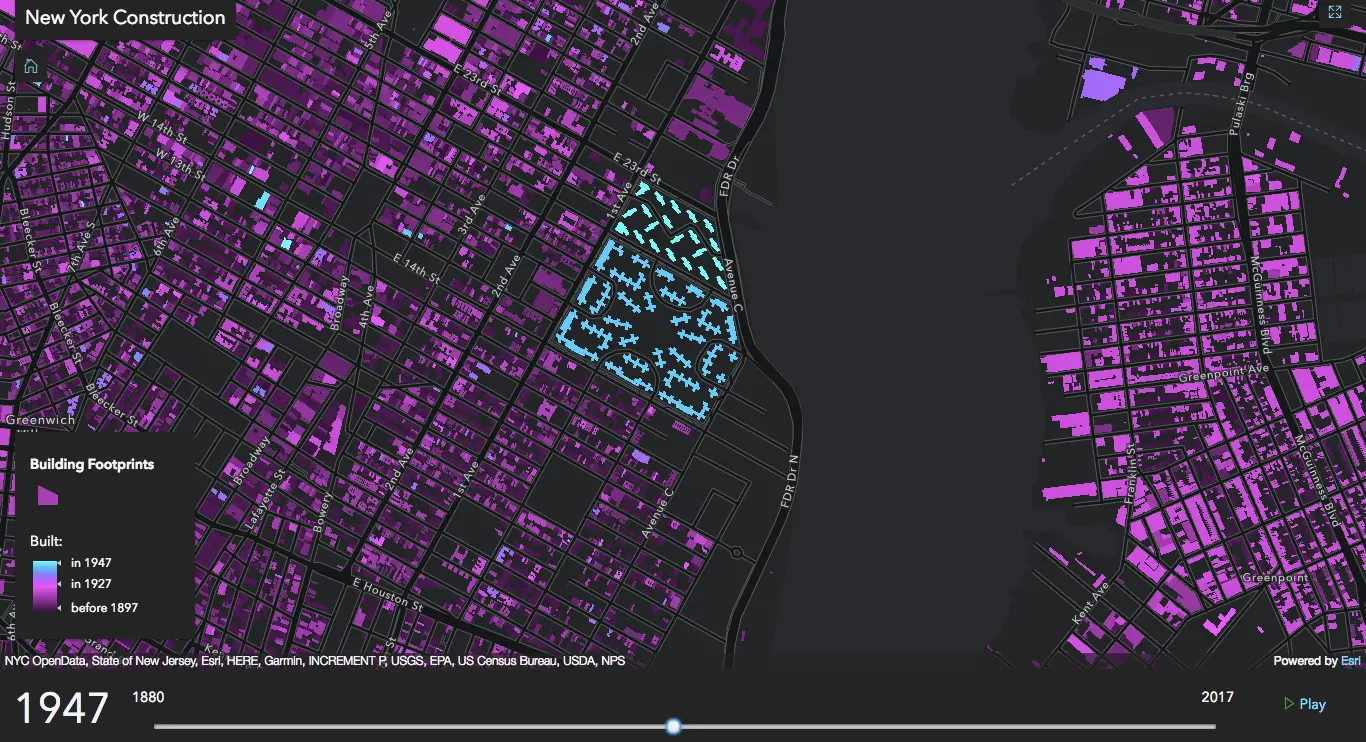
 Manhattan’s east side before (top) and after (bottom) the construction of Stuyvesant Town.
You can zoom in on a neighborhood, block or even a building. The busiest years on the timeline provide much-needed perspective; just when it seems we couldn’t squeeze in one more building, there’s a boom. The images above show the 80 acres of Stuyvesant Town just north of the East Village spring into existence in 1946 after World War II. The massive development was one of many throughout the nation that was intended to provide housing for returning veterans and their families.
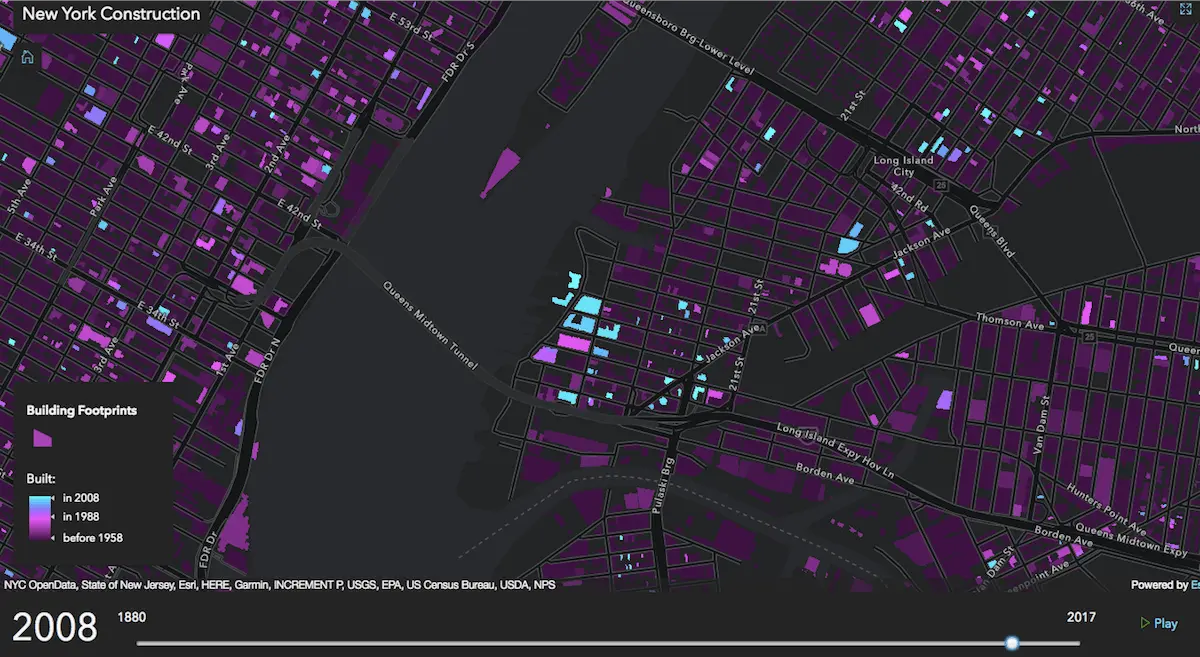
 LIC/Hunters Point construction action starting in 2007-8
In the mid- to late-2000s, Long Island City and Hunters Point went into overdrive as one of the city’s hottest development zones. To watch a city that’s constantly “under construction” come to life, press the “Play” button to animate the timeline between 1880 and 2017 for a great depiction of construction activity throughout that time. Check out the map here.
RELATED: