NeighborhoodX’s 3D Map Reveals the Blocks Where Real Estate Prices Are Soaring

Click for the expanded version >>
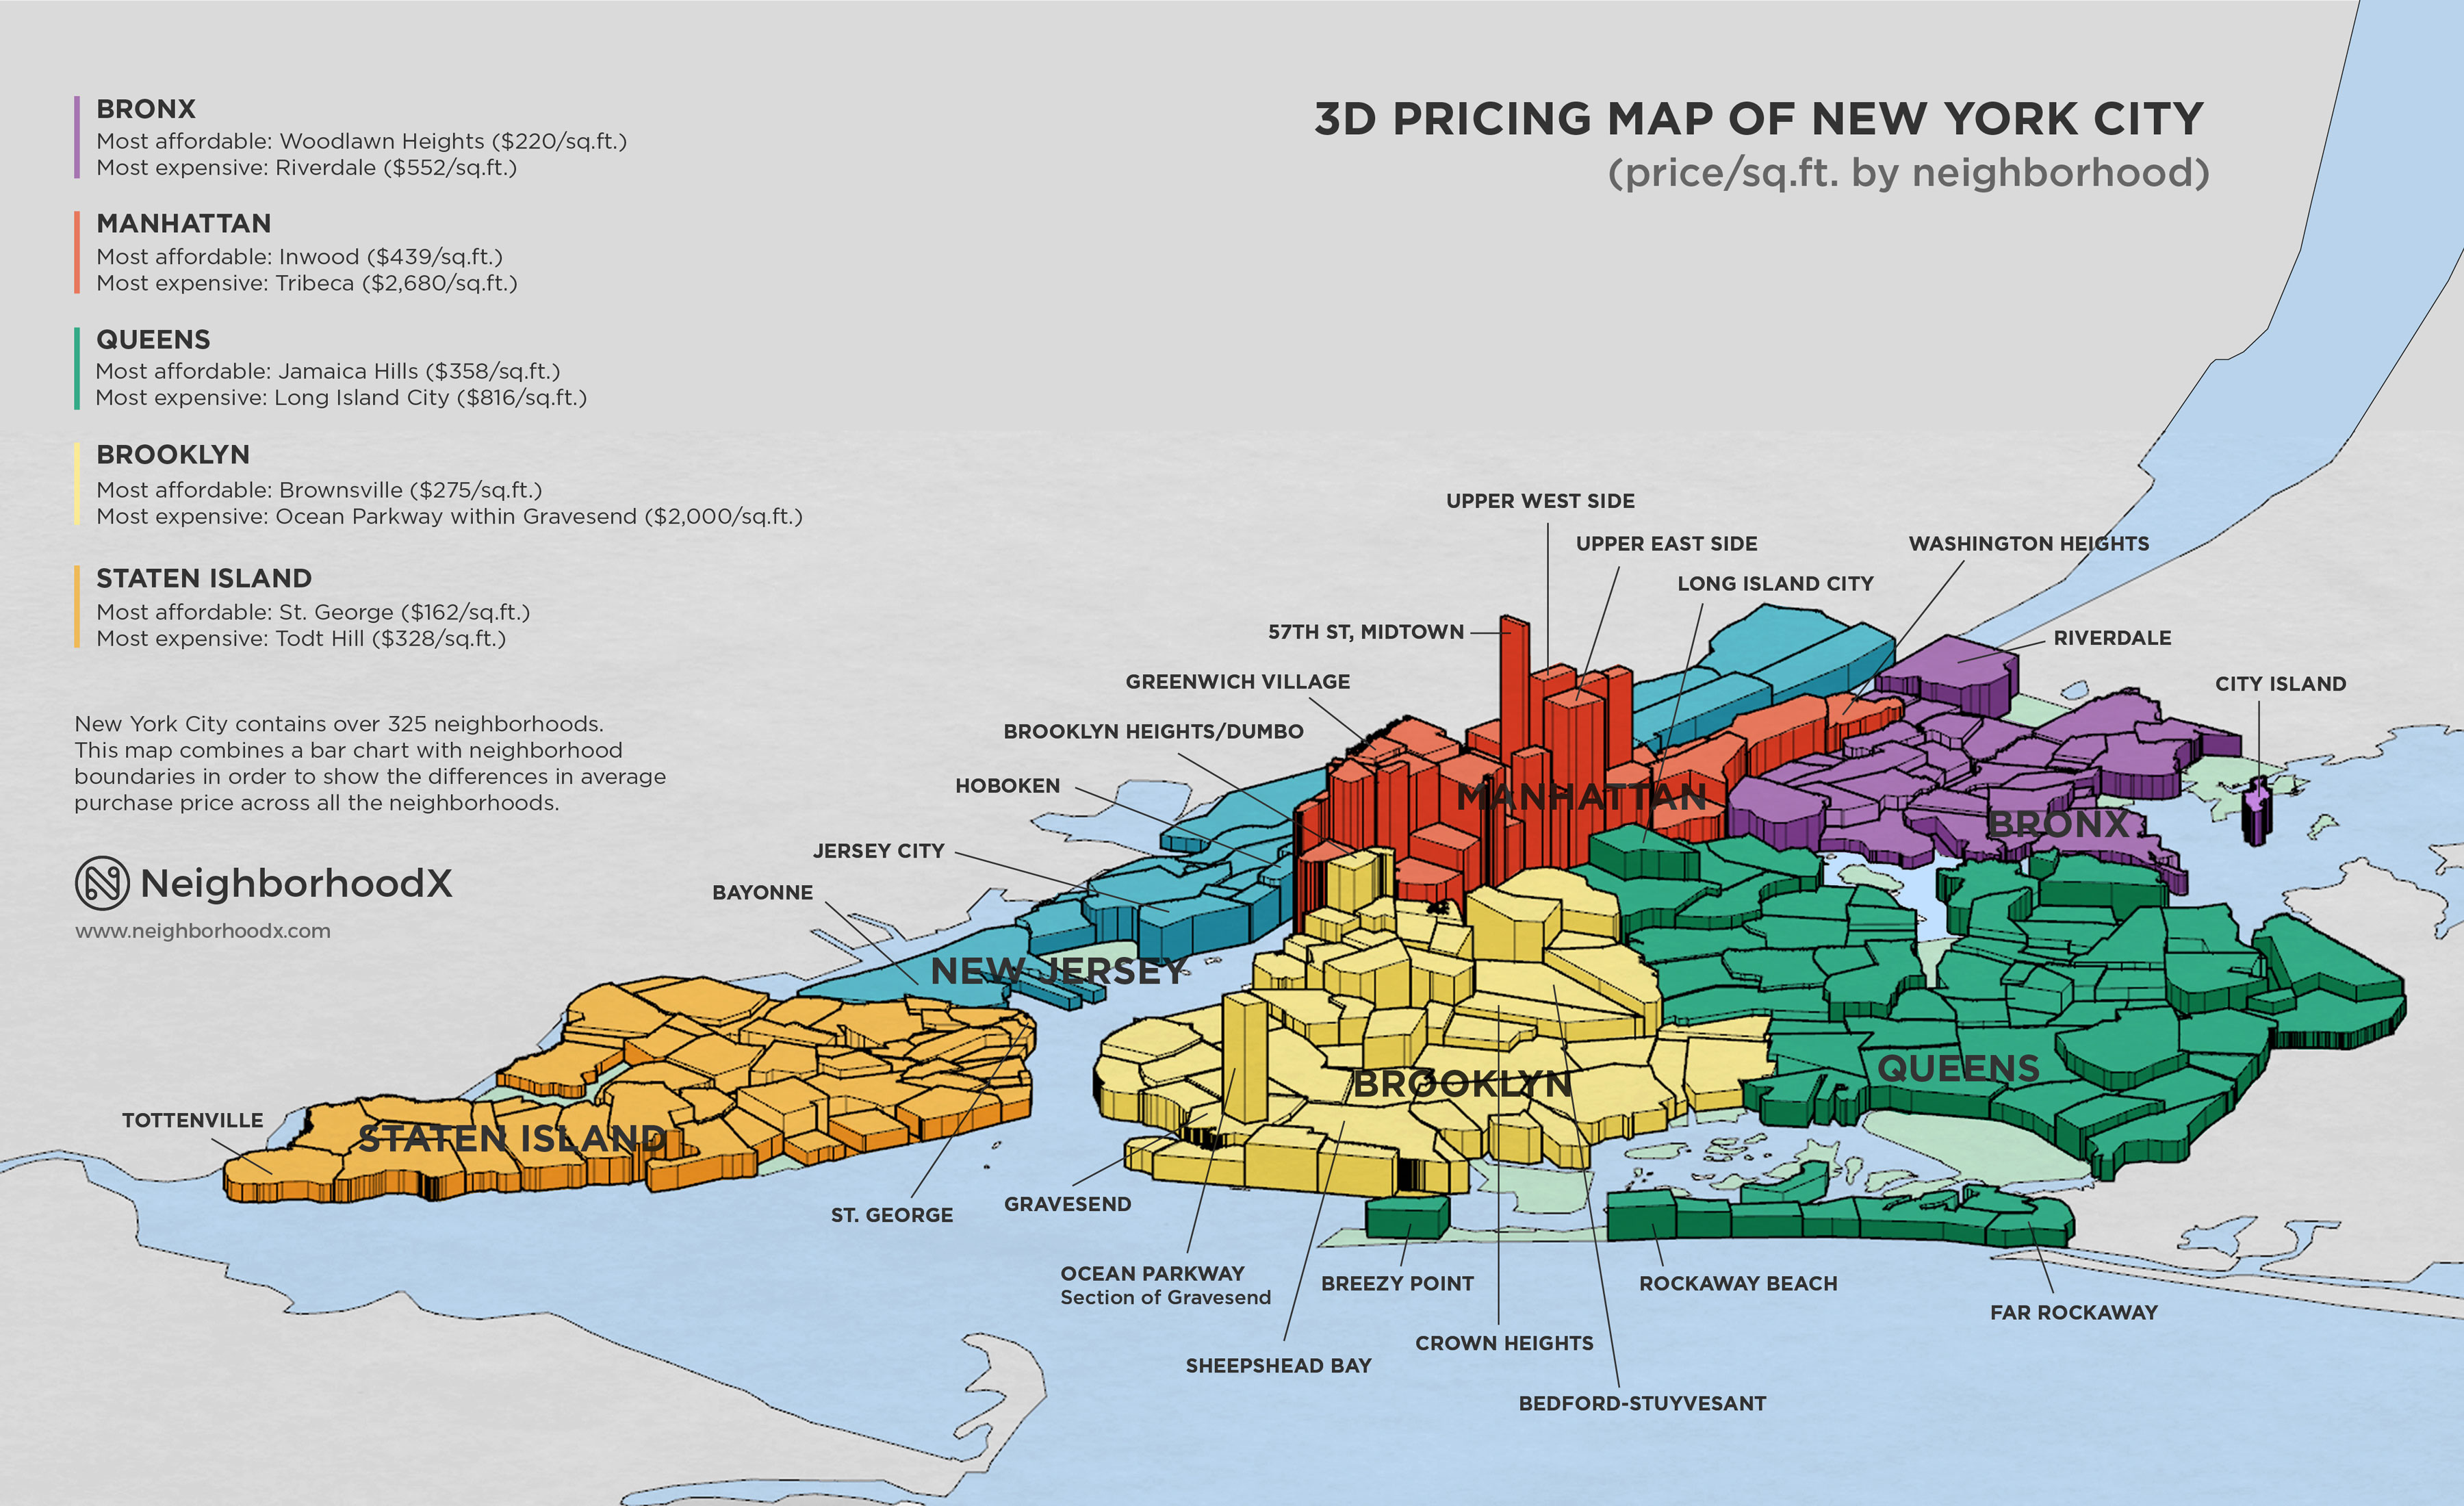
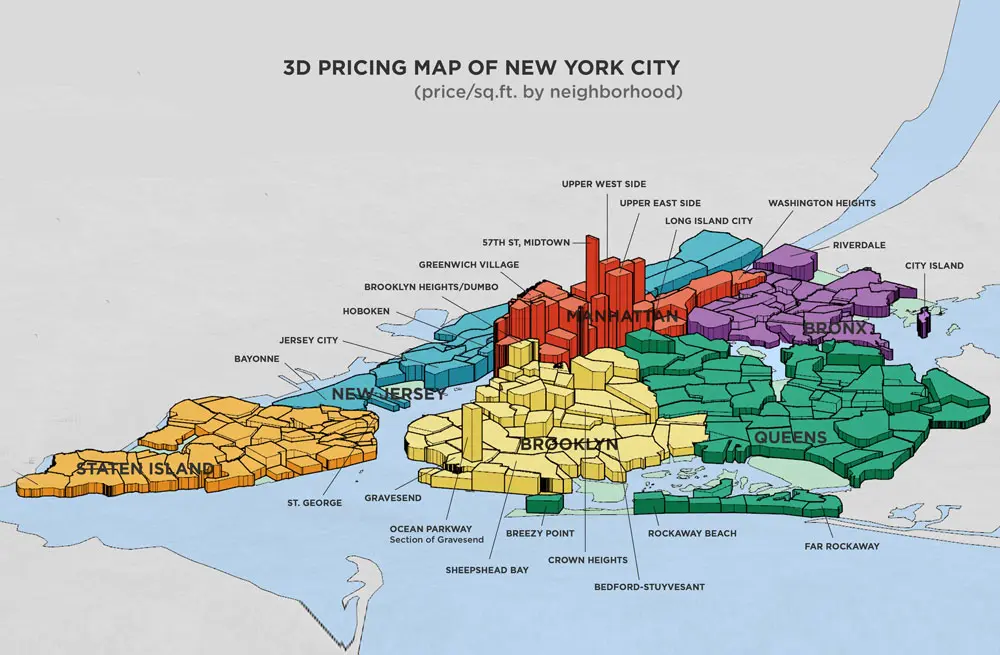
We all have a pretty good idea which NYC neighborhoods command top dollar, but this incredible 3D map from NeighborhoodX really puts things into perspective by pinning the city’s 325 neighborhoods against one another in a visually jarring side-by-side comparison. Among the most expensive? For Brooklyn, Gravesend beats out our best guess of DUMBO/Brooklyn Heights with its enclave of multi-million dollar, over-the-top mansions; and in Manhattan, Billionaires’ Row rises as a whole other beast with prices soaring as high as its supertalls.
 Click for the expanded version >>
NeighborhoodX is the creation of Constantine Valhouli and architect Cat Callaghan. The pair culled their data from popular real estate sites, additionally pulling out blocks within neighborhoods where they knew that prices have been extraordinary (e.g. Gravesend and 57th Street). This allowed them to avoid skewing the overall average of a given neighborhood, and more importantly, to give an accurate view of the trends occurring in the market.
Among the most affordable: Outside of Manhattan, “steals” can be found in Brownsville ($275 per square foot), Jamaica Hills in Queens ($359 per square foot), Woodlawn Heights in the Bronx ($220 per square foot), and St. George in Staten Island ($162 per square foot). In the city, Inwood is about six times less expensive that the island’s most expensive nabe, Tribeca (although Billionaires’ Row homes are said by Valhouli to be asking around $9,000 per square foot). Overall, Manhattan boasts the priciest homes of all.
More over at NeighborhoodX.
RELATED:

Interested in similar content?
Leave a reply
Your email address will not be published.


Park Avenue to Fifth Avenue area is labeled as Upper West Side.