New report shows NYC’s wealthiest neighborhoods saw the highest pandemic exodus

Photo by Jason Krieger on Unsplash
New York City Comptroller Scott Stringer’s office released a report this week revealing the impact the Covid-19 pandemic had on the city’s population. The numbers show that net residential migration out of NYC tripled during 2020–and residents of the city’s wealthiest neighborhoods were the ones most likely to move out. But those numbers appear to be reversing to a pre-pandemic level: Since July 2021, the city has gained an estimated 6,332 residents, and outward-bound migration has actually been lower than it was in 2019.
Looking at United States Postal Service (USPS) data from change-of-address forms, the report determined Manhattan was overall more likely to experience flight, and people living in the wealthiest 10 percent of city neighborhoods by median income were 4.6 times more likely to have moved in 2020 than other city residents.
Although the report shows that the number of outbound residents increased significantly in every borough overall in 2020, additional residential net out-migration was highest in the Manhattan neighborhoods of Battery Park City/Greenwich Village, Murray Hill/Gramercy, and the Upper East Side.
The opposite trend was true for the two Queens neighborhoods of Howard Beach/Ozone Park and Richmond Hill/Woodhaven, where net out-migration actually improved slightly in 2020.
It was noted that migration out of wealthier Manhattan areas has traditionally been higher due to a correspondingly large number of transient residents such as university students and residents who may leave for the season. But the report shows that the pandemic had a far greater impact on the borough than the usual ebb and flow.
Since July of 2021, USPS data has shown an estimated net gain of 6,332 permanent movers, mainly in the same neighborhoods that experienced the greatest flight. The reopening of offices, schools, and restaurants, and the restart of arts and entertainment events–in addition to the city’s robust vaccination campaign–has likely helped to entice residents to return.
Some specific major findings of the study include:
- In the first three months of the pandemic, from March to May 2020, more than 60 percent of net moves from city addresses were marked as temporary, indicating that the person or household intended to return, but since then 79 percent of net moves have been marked as permanent.
- Excluding moves marked as “temporary,” net out-migration from the city increased by an estimated 130,837 residents from March 2020 through June 2021, as compared to pre-pandemic trends.
- Residents from the city’s wealthiest neighborhoods were the most likely to leave. Residents in the wealthiest 10 percent of city neighborhoods, as measured by median income, were 4.6 times more likely to leave than other residents during 2020, recording 109 net move-outs per 1,000 residents vs 24 elsewhere. Moves from wealthier neighborhoods were also more likely to be recorded as temporary. About half of net out-migration from the wealthiest 10 percent of neighborhoods was marked as temporary in 2020, compared to 44 percent in the next wealthiest decile and less than 30 percent elsewhere.
- In September 2021, New York City public schools and colleges opened to full-time, in-person learning; some employers, including city government, called office workers back; and the curtains rose on Broadway after an 18-month shutdown. Not surprisingly, these events coincided with an improvement in net residential migration to the city, particularly in the neighborhoods that experienced the greatest flight in the spring of 2020.
- Since July 2021, USPS data has shown an estimated net gain of 6,332 permanent movers, indicating a gradual return to New York City, mainly in neighborhoods that experienced the greatest flight. On a per-capita basis, the largest net gains over the summer were in Chelsea/Midtown, Murray Hill/Gramercy, Battery Park City/Greenwich Village, and Chinatown/Lower East Side.
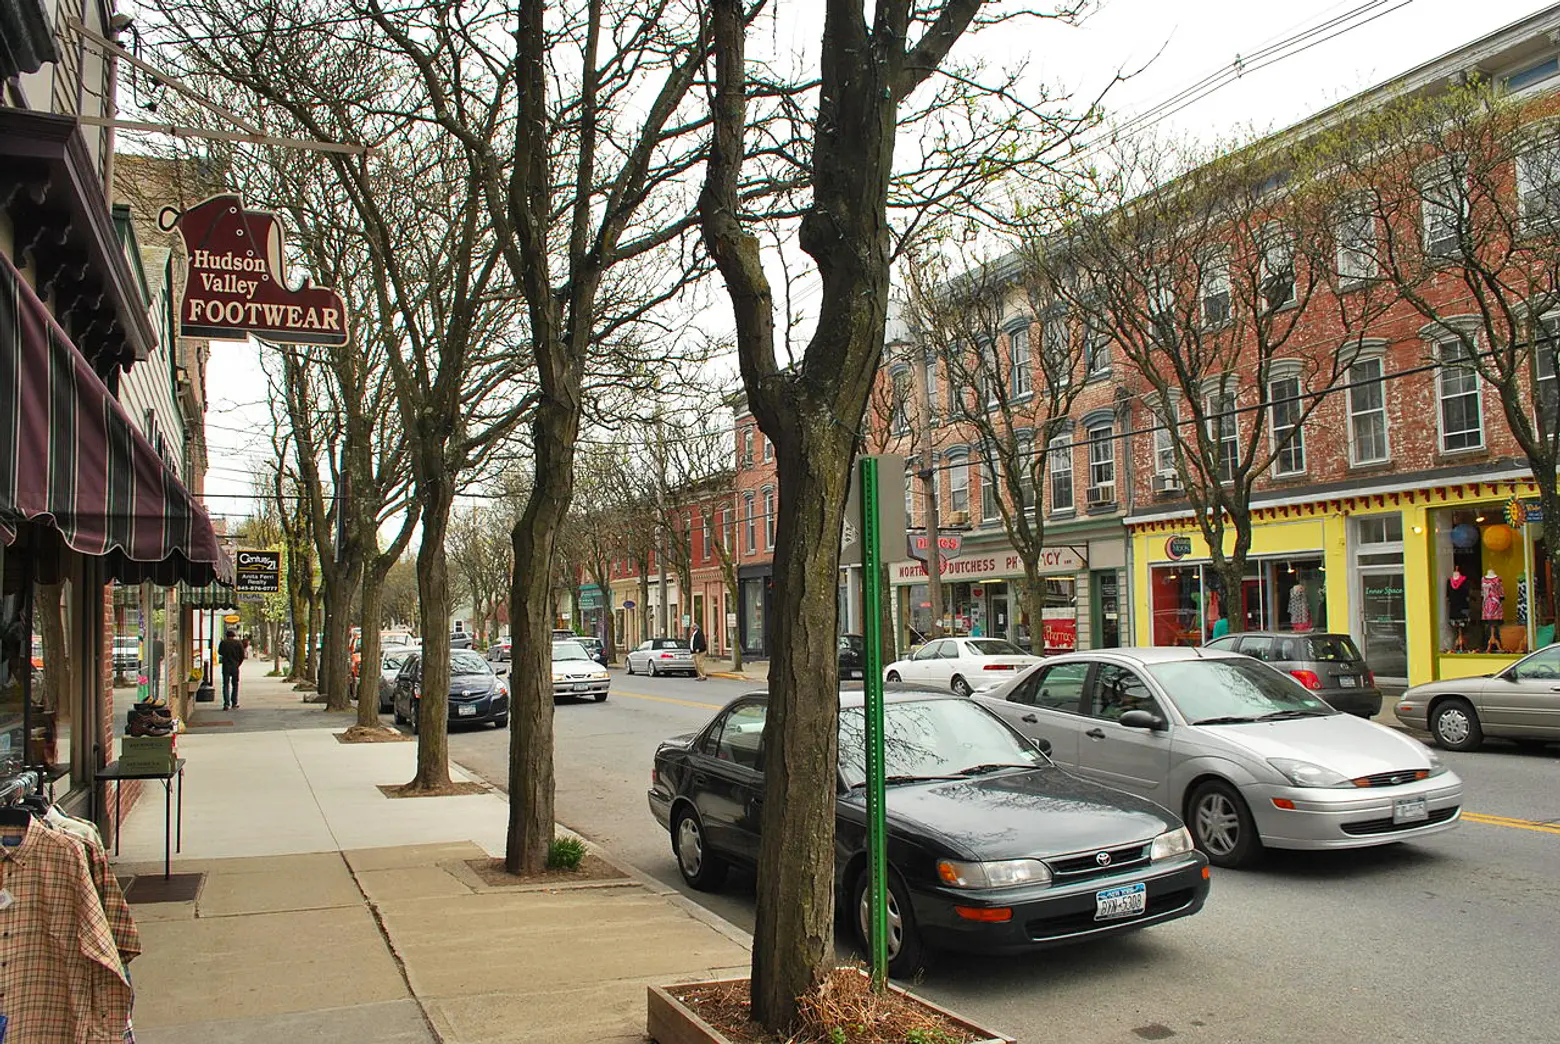 Downtown Rhinebeck, NY. Photo by Juliancolton via Wikimedia Commons
As 6sqft reported in January of this year, there was a sizable population shift to areas outside the five boroughs. Luxury home sales rose as much as 270 percent in upstate counties like Putnam, Duchess, Garrison, and Rhinebeck. Home sales and prices spiked in Westchester County, the Hamptons, and neighboring Connecticut as well.
But the return to urban life appears to be underway. From June to September 2021, the city’s net population loss was 39,961 residents, fewer than the 40,494 people who moved out in 2019. And 14 city neighborhoods outperformed their pre-pandemic trends, with the highest net gains in Chelsea/Midtown, Murray Hill/Gramercy, Battery Park City/Greenwich Village, Chinatown/Lower East Side, and the Upper East Side.
Last summer, 6sqft reported on home prices falling in some of the city’s priciest neighborhoods at the height of the pandemic. Those lower prices and lower rents, pent-up demand for change after a year of lockdowns, the reopening of bars, restaurants, museums, and other cultural institutions, and the restart of school may usher in a robust rebound.
Recent months have seen high-end rentals and residential sales surpassing even pre-pandemic levels, with apartment sales in Manhattan hitting a 32-year high last quarter.
Looking ahead, the report concludes the city’s population trends in the future will depend on the ability to maintain activities and attractions, and on the future of the workplace overall, now that employees have more options when it comes to remote work and commuting.
“New York City is steadily reopening and New Yorkers are returning to the city we love—that’s why it’s vital that we invest in the value proposition that is New York City and make sure we continue to be the best place to live, work, and raise a family,” Stringer said in a statement. “We have a once-in-a-generation opportunity to reimagine our city and build back stronger than ever from the losses of the pandemic.”
The new report, including neighborhood-level and zip code-level interactive maps, is available here.
RELATED: