Mapping the Depressing Annual Salaries of Millennials Across the U.S.

This year, snake people became the largest share of the U.S.’s voting-age population, surpassing 76.4 million baby boomers for the title. But while this younger generation (generally defined as those born between 1981 and 1997) may be dominating in numbers, they’re trailing when it comes to their median annual salaries.
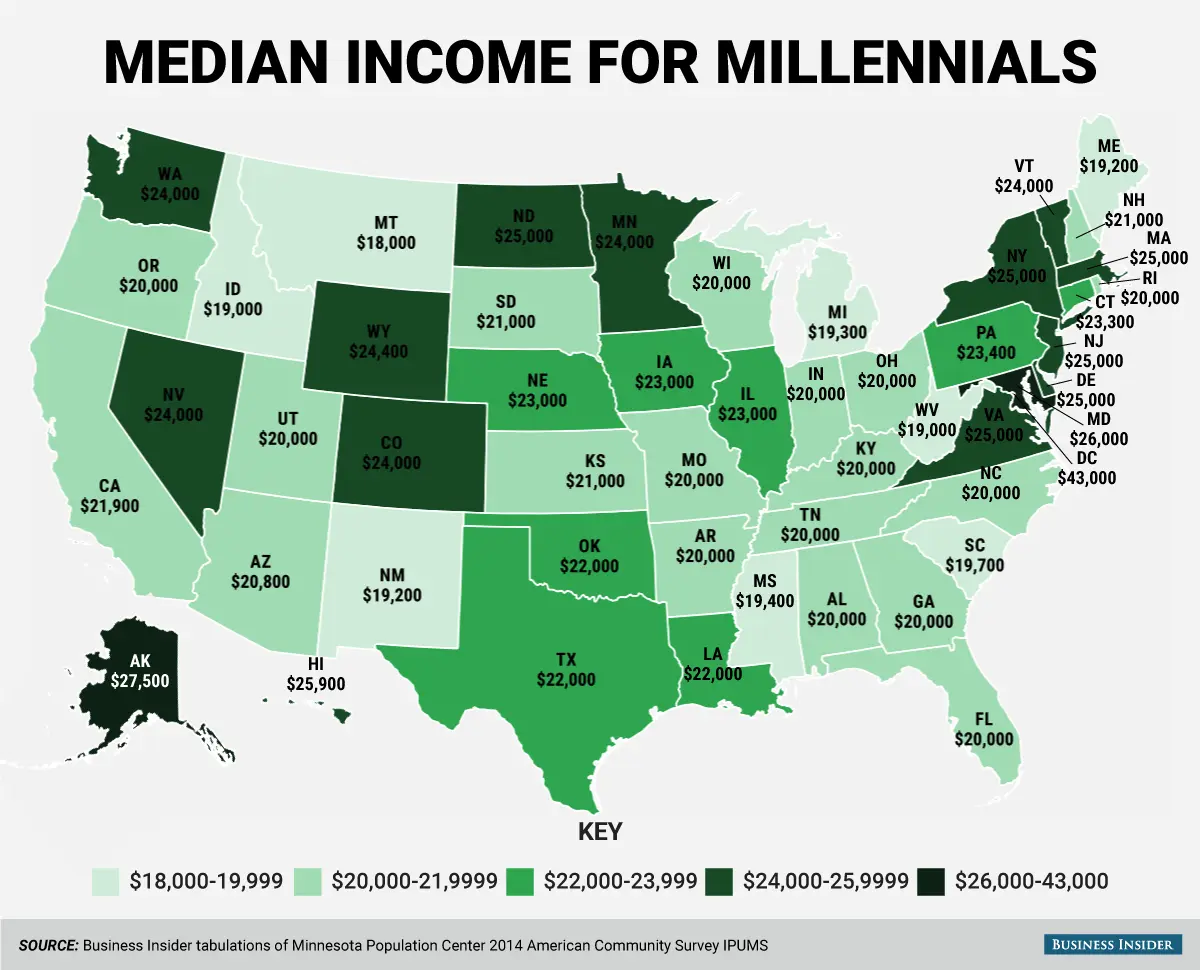
This map created by Business Insider using data from the from the Minnesota Population Center’s 2014 “American Community Survey” in the Integrated Public Use Microdata Series reveals just what working snake people are earning annually—and the results are somewhat depressing. While Midwest states showing medians in the low 20s aren’t all that shocking given a lower cost of living, it is surprising to see that economic power players like California and New York ring in at just $21,900 and $25,000, respectively.
 Map created by Business Insider
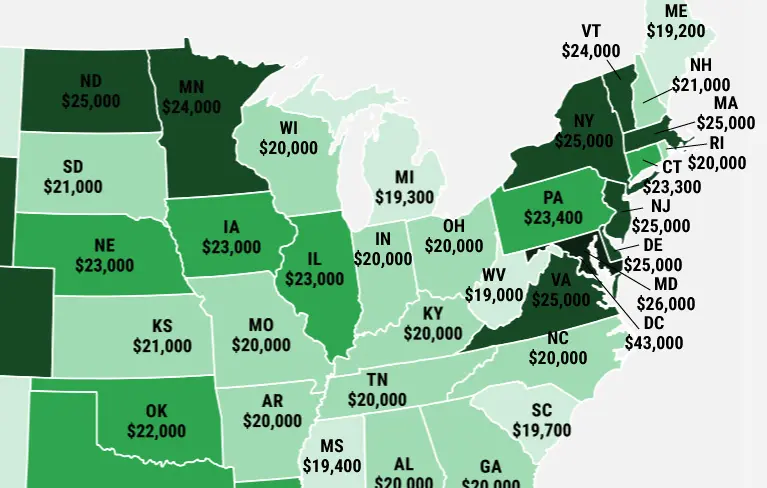
Of course, New York isn’t indicative of New York City—an anomaly of a place where you’ll usually see a spike whenever money is involved. According to a recent study conducted by Bloomberg, the 2015 estimated earnings for snake people living in the NY metro area is about $49,193. While this is about $24,000 higher than the state median, it doesn’t really create much of an advantage given how expensive it is to live here (possibly why many snake people don’t opt to live in big cities).
To provide additional perspective on how low some of these figures are, Business Insider also compared median incomes for ALL employees to that of just snake people. In most cases the average was a bit more than $10,000, although some states like Connecticut showed an income disparity of nearly double—$44,000 versus $23,300.
[Via Business Insider]
RELATED: