Metro Region Explorer map gives you the facts on any spot in the Tri-State area

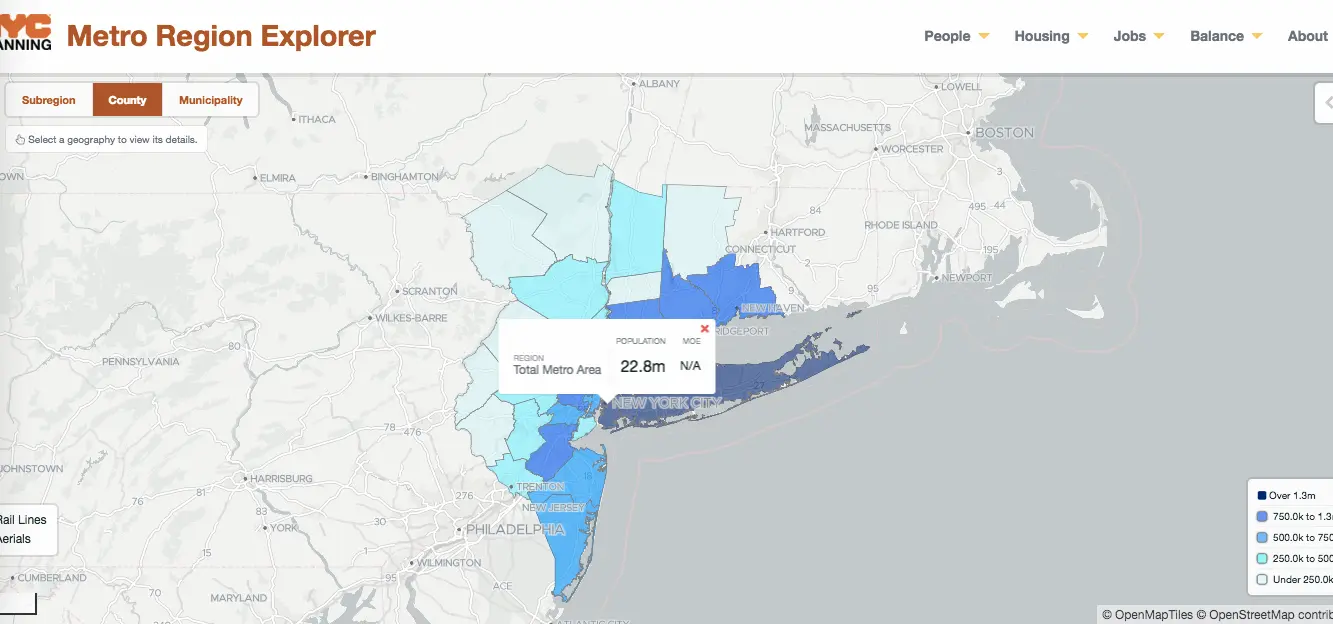
As a beta project created by the NYC Department of City Planning, Metro Region Explorer enables you to explore population, housing, and employment trends within the Tri-State New York City Metropolitan Region. The map was developed as part of an ongoing commitment to providing better public access and as a way to better understand information about planning issues that affect the city as well as the region, as many planning challenges are interconnected with the realities of the larger area surrounding the city’s core.
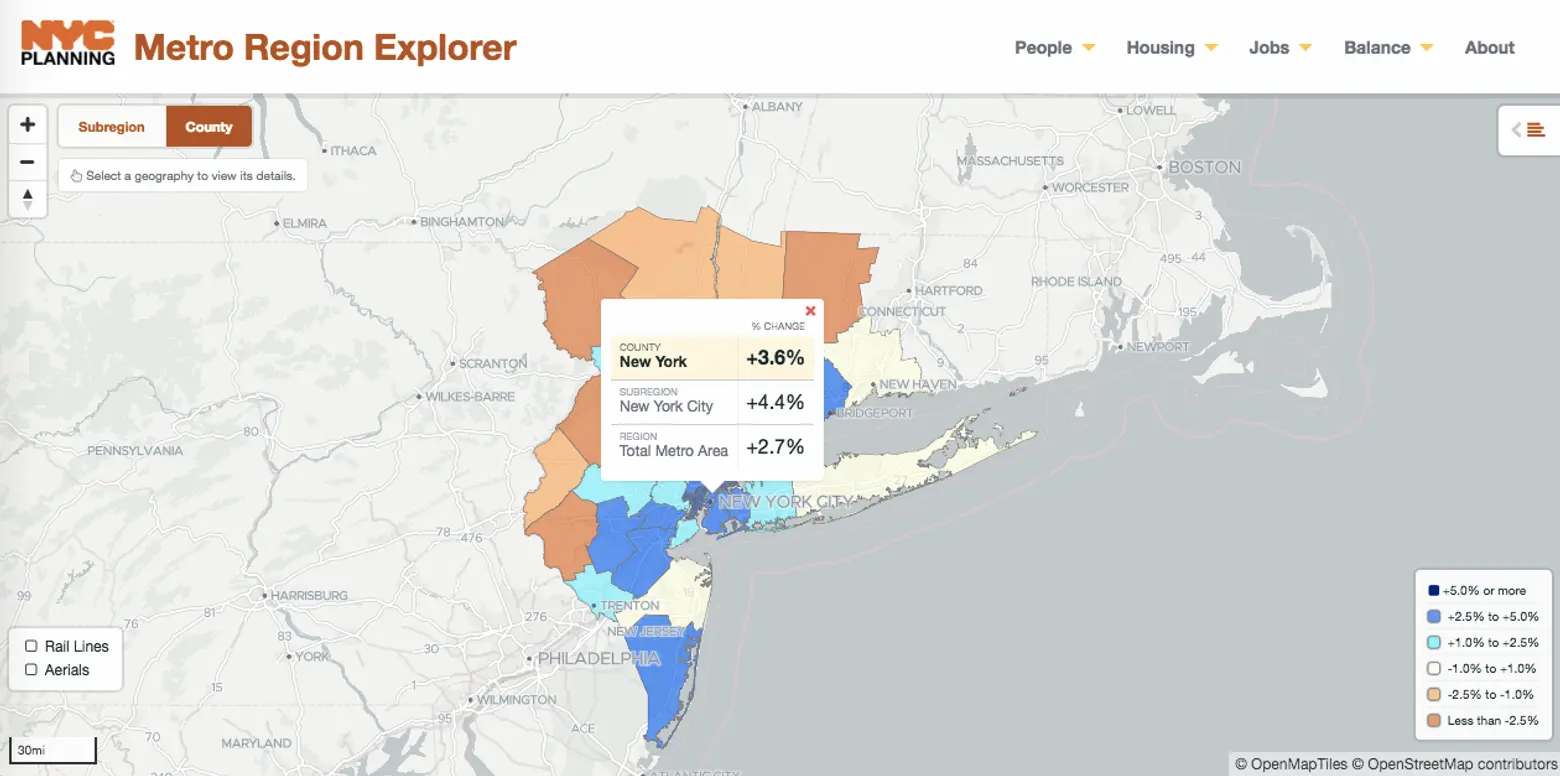
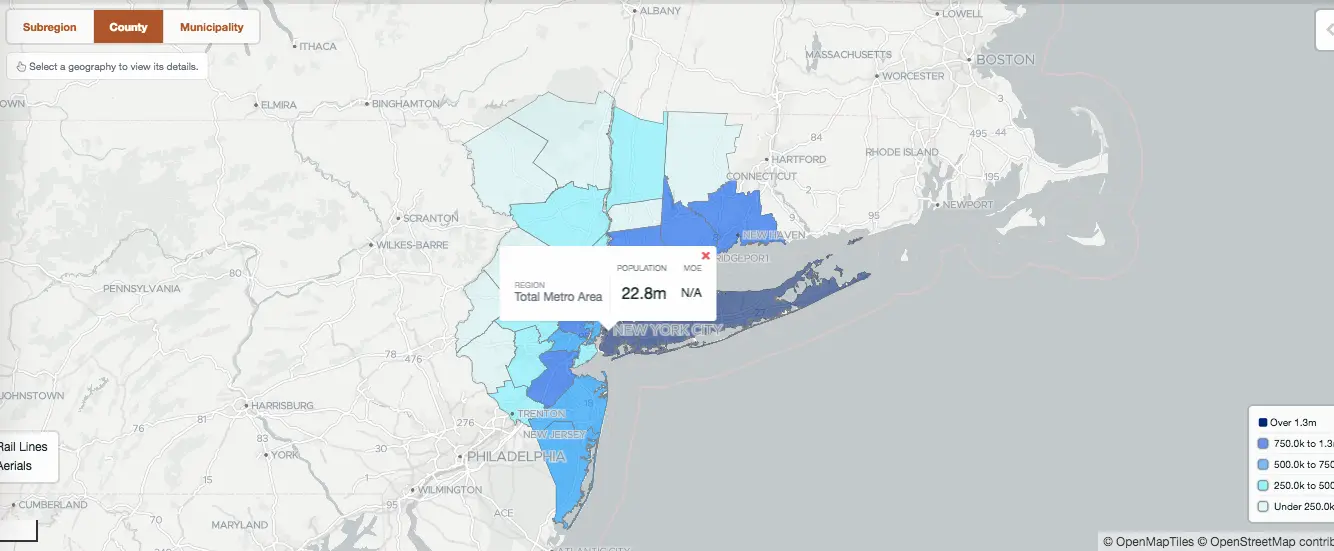
Population growth has shifted toward the city’s center; map: NYC Planning Metro Region Explorer.
You may have already known these statistics about the city and the region…
- NYC is the nation’s largest city, within an even larger tri-state metropolitan area.
- Today’s tri-state region is home to nearly 23 million residents, the largest in the United States.
- New York City’s 8.53 million residents in 2016 represented 37% of the metro region’s population.
- The next largest city in our region is Newark, which has a 2016 population of 282,000.
- There are nearly 900 municipalities in our region, 500 of which have populations smaller than 10,000 residents.
- Excluding NYC, the region has an average municipal population size of about 20,000 residents.

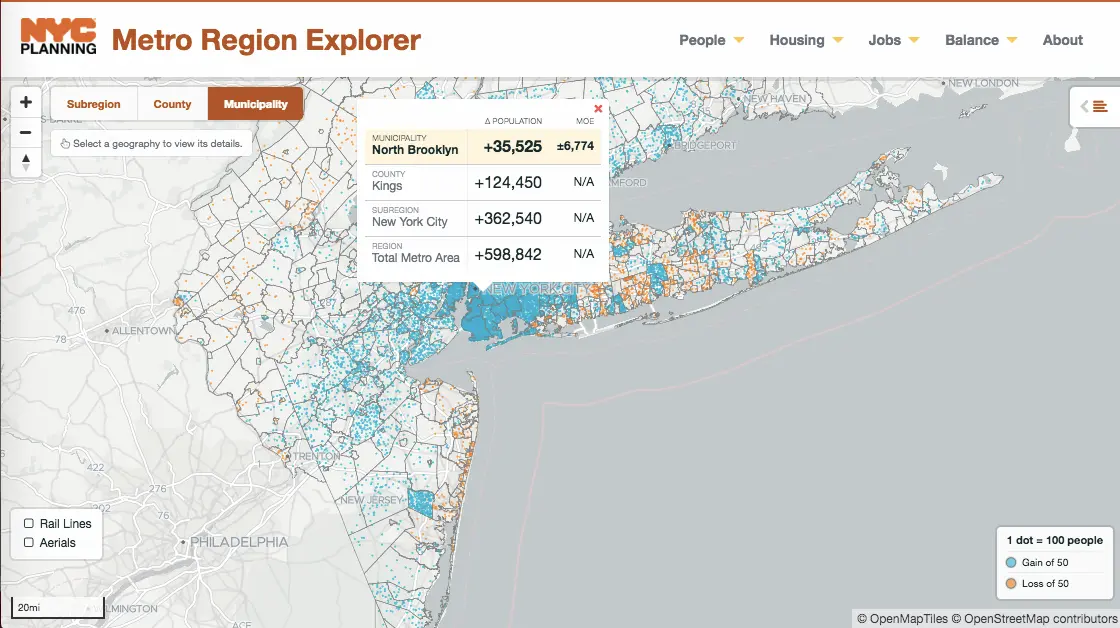
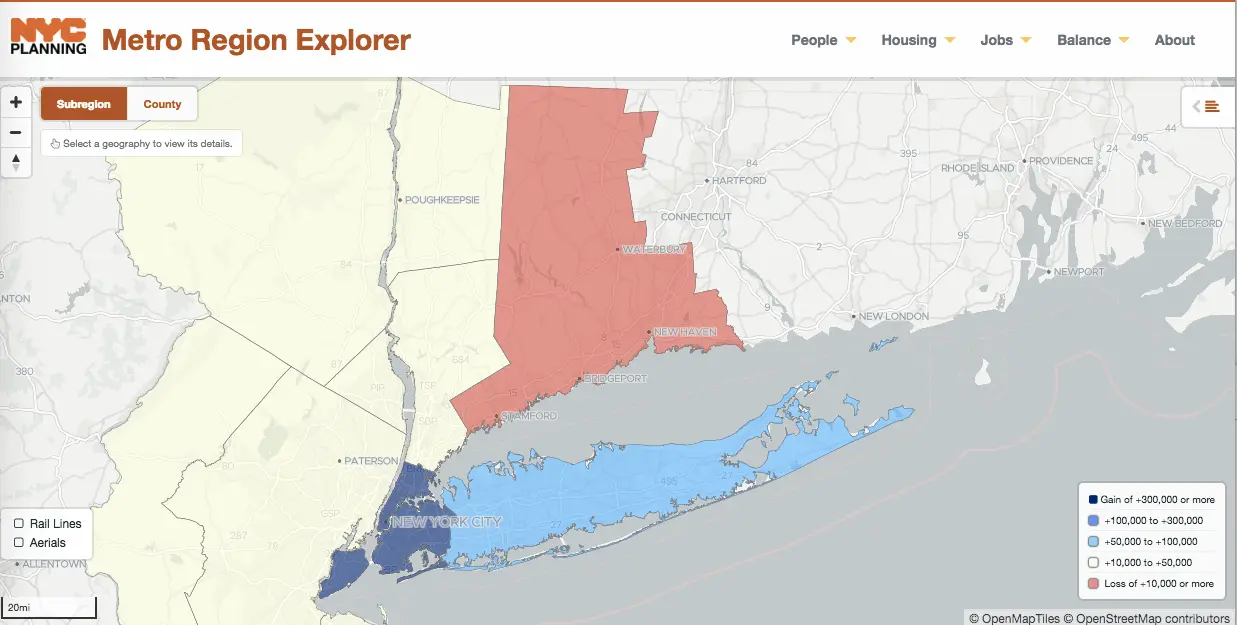
Net population change, 2010-2016; map: NYC Planning Metro Region Explorer.
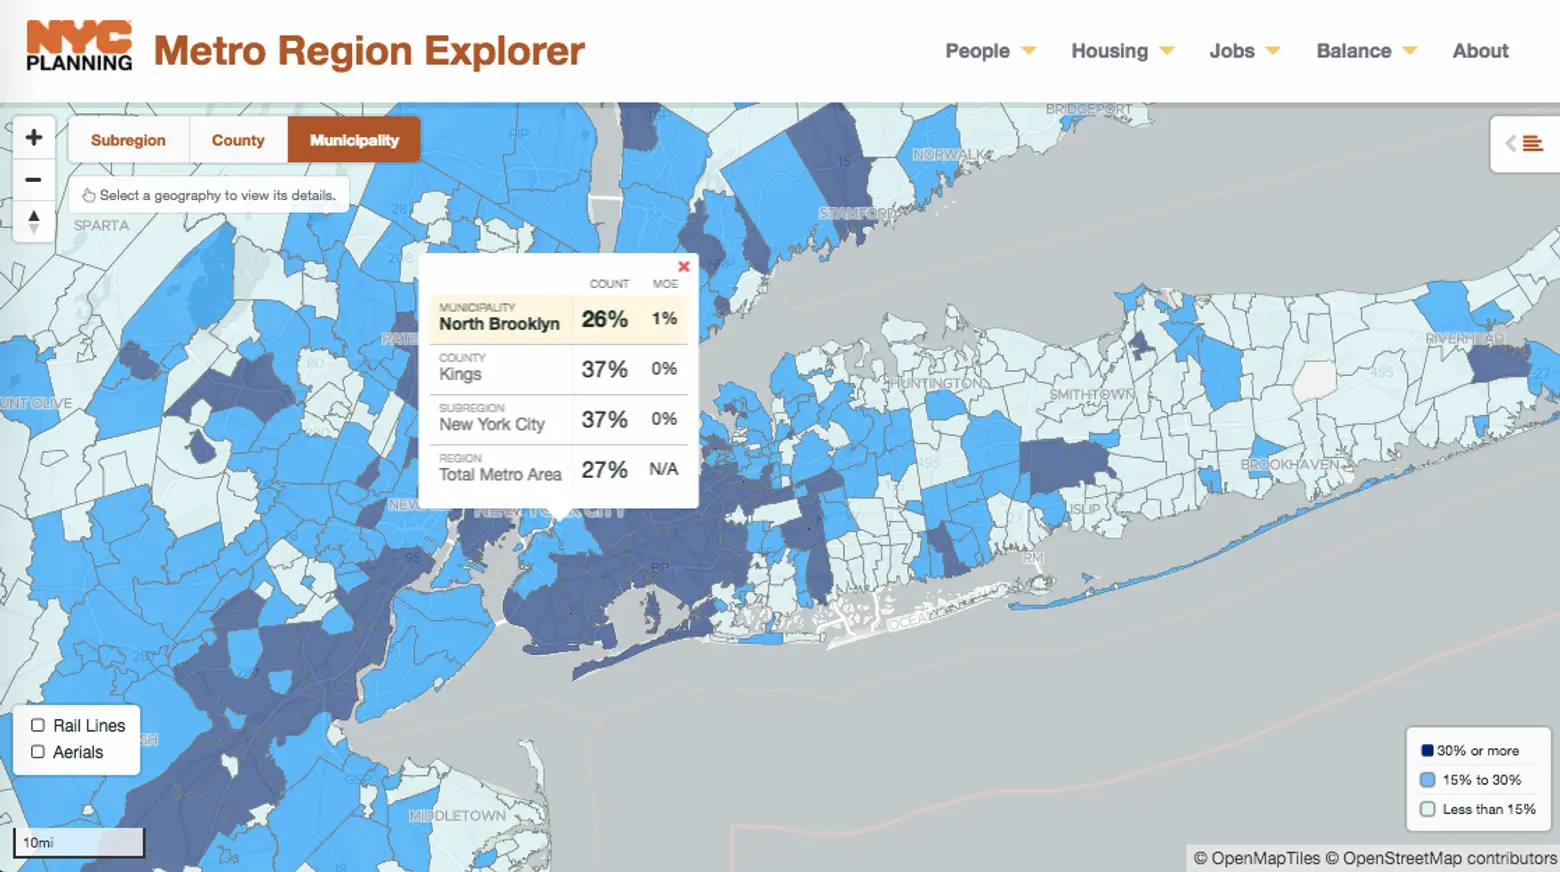
Foreign born as share of total population, 2012-2016 average; map: NYC Planning Metro Region Explorer.

Post-recession, NYC saw the majority of regional job gains. Above: Private employment change, 2008-2016; map: NYC Planning Metro Region Explorer.
But did you know that:
- Population growth has shifted towards the region’s center.
- Growing areas are among the most diverse.
- Prime-age labor force (age 25-54) grew the most at the region’s center.
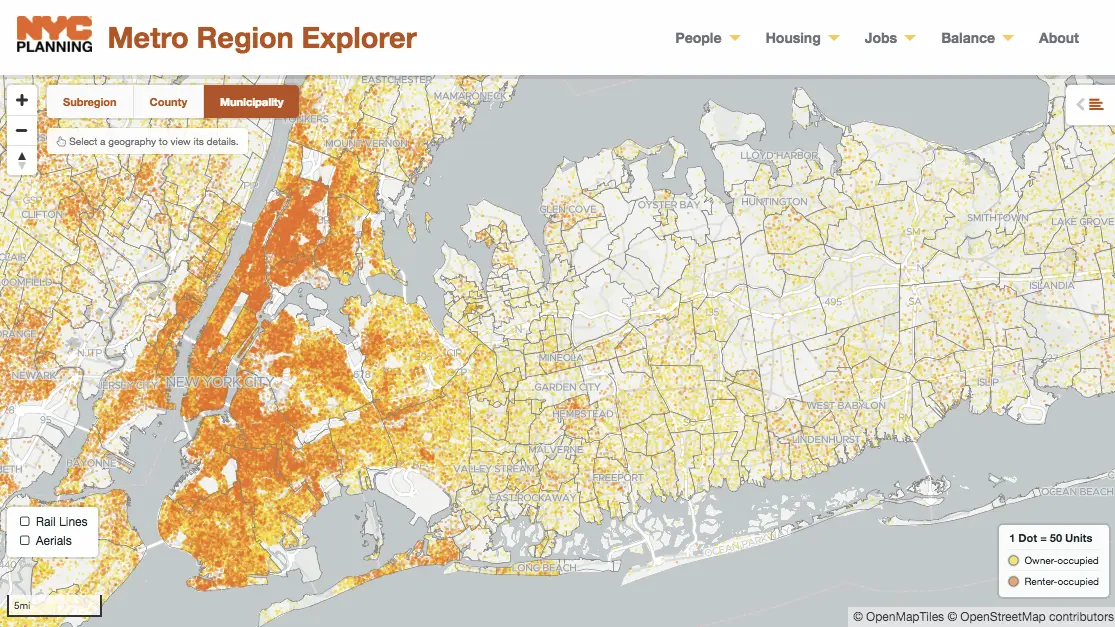
- The region’s rental housing is concentrated in NYC.
- NYC and NJ are building the majority of new housing in the region.
- NYC is the hub of the largest U.S. metro economy.
- Post-recession, NYC saw the majority of regional job gains.
- The patterns of employment growth and housing development have changed the jobs-housing balance throughout the region.
There are many, many more interesting facts and statistics to compare. With the map, you can check out population growth numbers by region to see where people are headed–and headed away from–where the workers are, where the most new homes are appearing and more. You can check out the map here, to explore by subregion, county and municipality.
RELATED: