How Citi Bike stacks up against other U.S. bike shares

After initial skepticism and half-hearted arguments from bike-haters and snide remarks from bike snob cities like Seattle and San Francisco, New York City’s first official bike sharing system has turned out to be a success–that much we know. The numbers compiled by Priceonomics Data Studio for their client Spin reveal some surprising numbers when it comes to how we’re using those bikes. D.C., for example, beat the other cities handily on most metrics, with San Francisco and Seattle consistently at the bottom of the list. Ok, so the research was done for a bike sharing startup hoping to expand its station-less system (more on that, too), but it’s interesting to compare statistics of share programs in the nation’s biggest adopters of this new public transportation option–and get a chance to see how Citi Bike fares.

In Paris in 2001, mayor Bertrand Delanoë implemented a bike sharing program enabling people to rent bikes within a network of stations throughout the city. The effort was intended to spread the environmentally friendly practice of riding bicycles in a city of apartment-dwellers with little room for bike storage and a familiar fear of parking their bikes on the street. This effort came at the right time to spark a bike sharing revolution throughout the world. In the past ten years, hundreds of international cities have launched bike sharing plans, adding up to over 700,000 bicycles. As 6sqft previously reported, in 2016, there were 14 million Citi Bike trips taken, an amazing 40 percent more than the previous year.
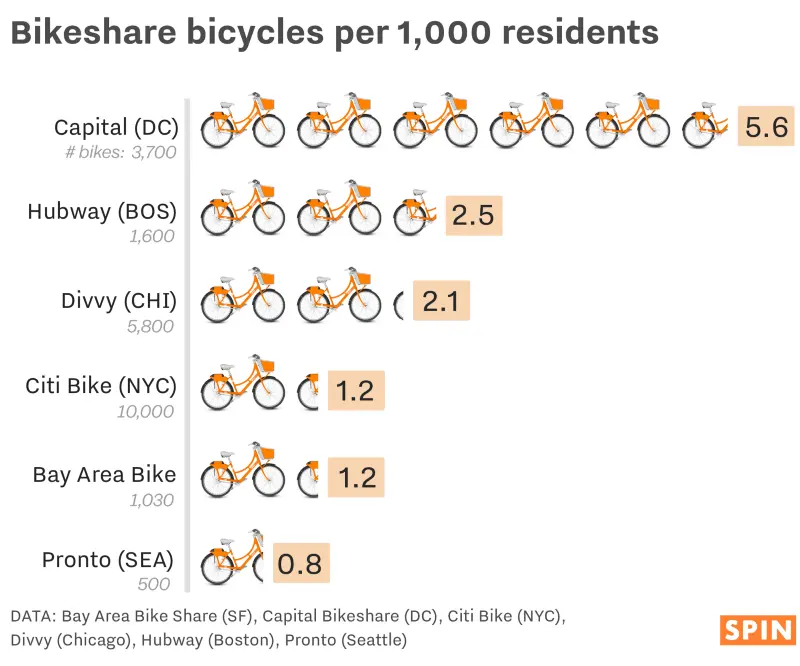
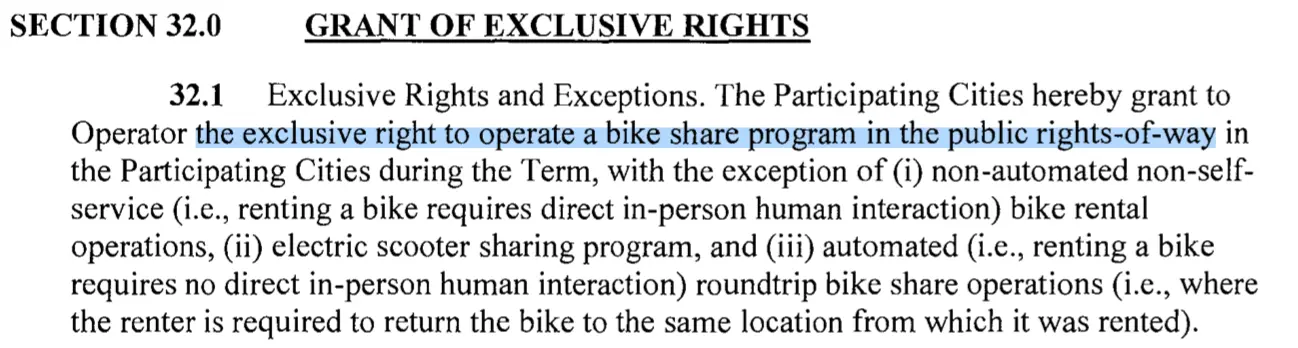
Spin and Priceonomics took a broad look at how many people in some of the country’s most densely populated cities were sharing and riding. Looking at a year’s worth of data in 2015-16, in raw numbers representing the number of share bikes on the road, New York City’s Citi Bike system has the largest army, an astounding 10,000. Cities like Seattle (500 bikes) and San Francisco (1,030 bikes), with a rep for starting America’s bike revolution overall, had far fewer. Calculating bikes per 1,000 people, SF and Seattle somewhat surprisingly bring up the rear. Even more surprising is the top spot, D.C., which may not strike many as a city on two wheels.

D.C. also pulls way ahead of the pack in the number of stations it offers share riders (5.6). NYC ends up near the bottom with 2 per square mile, though it’s worth noting that late 2016 saw a huge expansion in the number of bikes deployed in the five boroughs and even more to come this year.

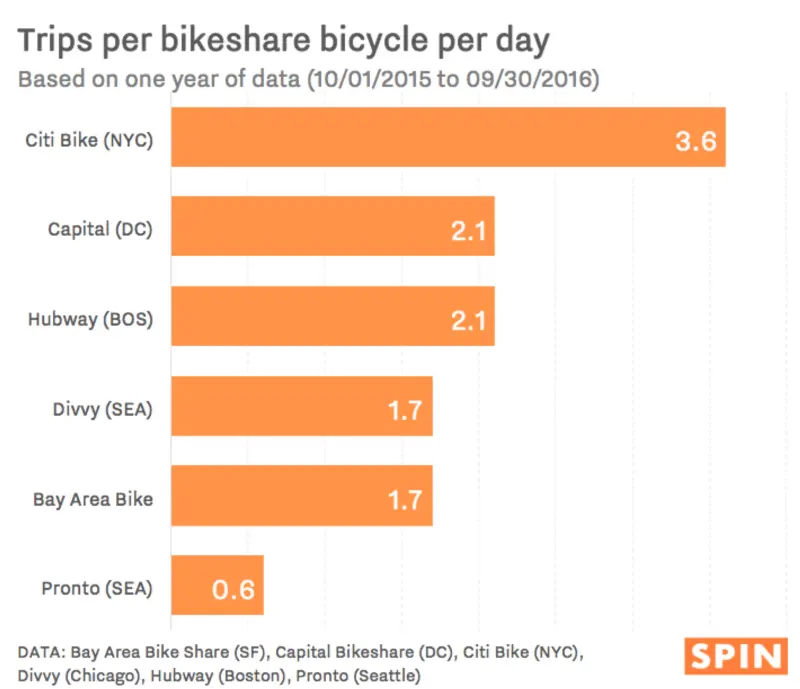
New Yorkers took more bike trips per day than the other cities (3.6), with the Bay Area and Seattle taking a beating here as well.

This one’s no surprise: New Yorkers are always in a hurry. Time spent on bike trips was second lowest to San Francisco, with only 18:07 spent in the saddle.
Spin goes on to make the case for stationless share systems, explaining that station-based bike systems are limited by the strength of their station network. Based in the Bay Area, the company points to how that city is low on both stations and usage, despite its bike-friendly reputation. The stationless system lets people pick up and drop off bikes anywhere legal at $1 per trip.
Images: Spin via Priceonomics.
RELATED: