Interactive map reveals NYC buildings where affordable housing is being threatened

New York City currently maintains about 178,000 affordable housing units, a number that is getting a boost with Mayor de Blasio’s plans to preserve or build 200,000 more units over ten years. However, while de Blasio has put the preservation of affordable housing at the heart of his administration’s work, there’s still a lot of headway to be made, and the threat for displacement remains high for a considerable number of New Yorkers. But who is at most risk? A new map (h/t DNA Info) created by the Association for Neighborhood and Housing Development (ANHD) seeks to shed some light on what areas, and even more specifically, which buildings, will likely see rent hikes in the near future.
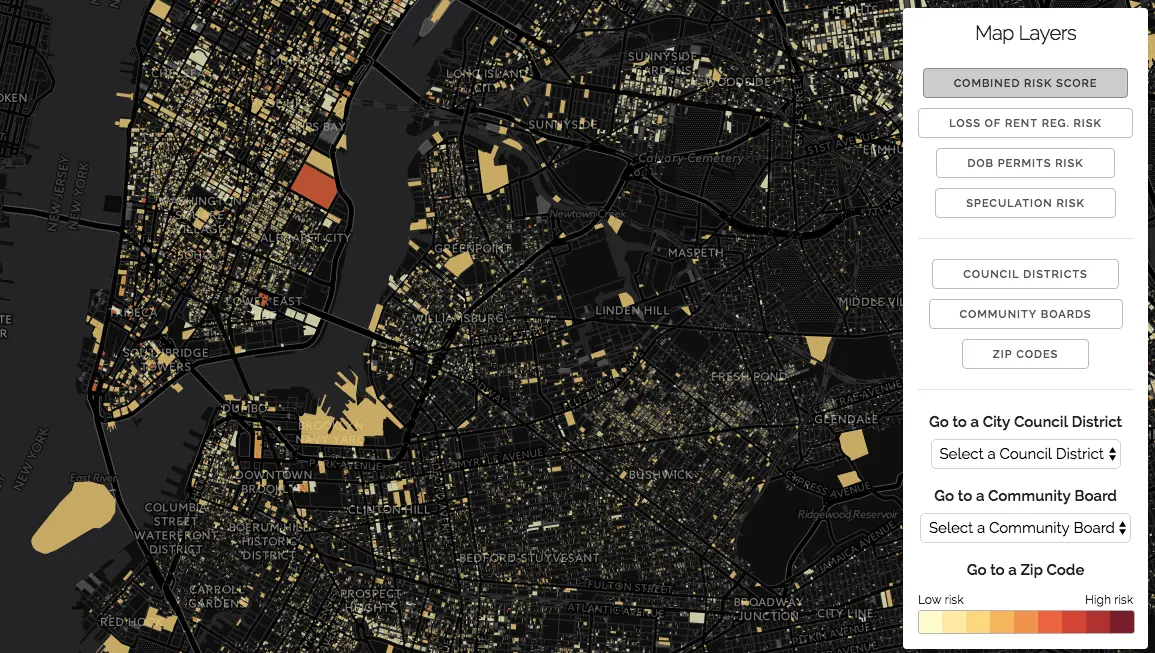
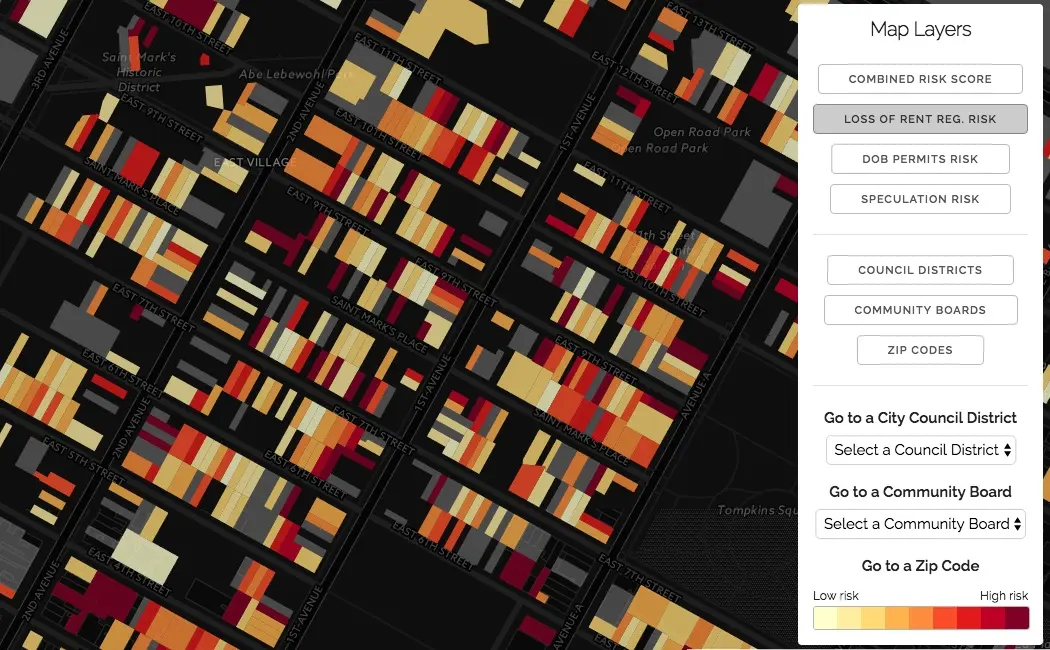
Per the ANHD, the map, aptly called “The Displacement Alert Project Map,” considers buildings that maintained at least one rent-regulated unit between 2007 and 2014 and more than five residential units overall. To determine displacement risk, which has been handily color-coded, the group considered the following factors:
-
Loss of rent regulated units in the building. This accounts for all buildings that had at least one rent-regulated unit between 2007-2014; a percentage risk was calculated from the number of rent regulated its remaining in 2015 as compared to those present in 2007
-
Volume of NYC Department of Buildings permits that indicate a high rate of tenant turnover. This points to whether tenants were vacated so that buildings could be replaced or renovated to suit market-rate or even luxury tenants, and the subsequent rent increases
-
Level of building sales prices that indicate speculative building purchases. Purchases priced well above the neighborhood average could indicate that an investment is being made in anticipation of neighborhood changes
-
The combined score of the three indicators adove were used to indicate building and tenant vulnerability
According to DNA Info, the ANHD’s research revealed a total loss of 156,000 rent-regulated units between 2007 and 2014. Manhattan saw the largest decrease over this period with 74,900 rent-regulated units lost, while Brookyln shed 41,500 units during this time. Neighborhoods that have been characterized as the fastest gentrifying unsurprisingly recorded the greatest losses, and this includes Bushwick, Ridgewood, Sunset Park, East Harlem, Astoria and parts of the Upper West Side.
The ANHD hopes government officials will use the map to help shape policy decisions with respect to the preservation and generation of affordable units, and that activists will use this as a tool to fight back against displacement.
Access the map here to see more >>
[Via DNA Info]
RELATED: