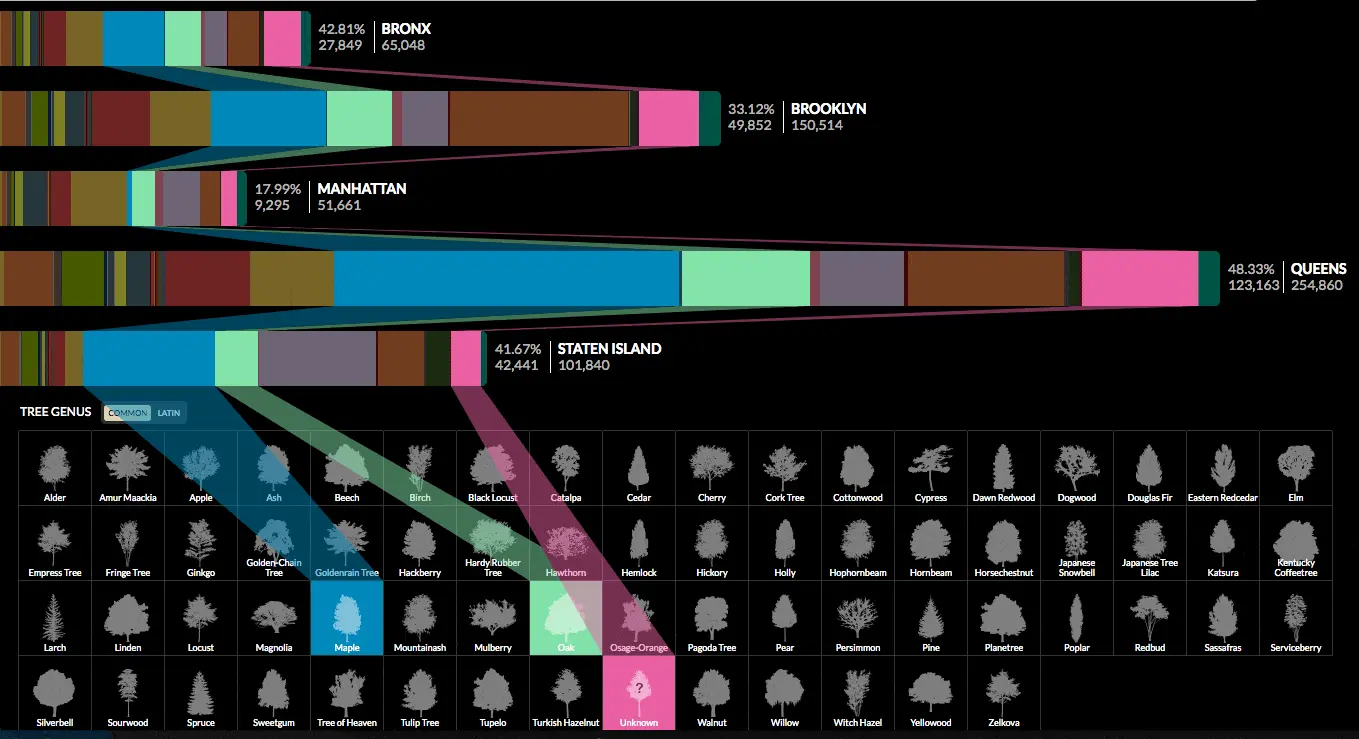
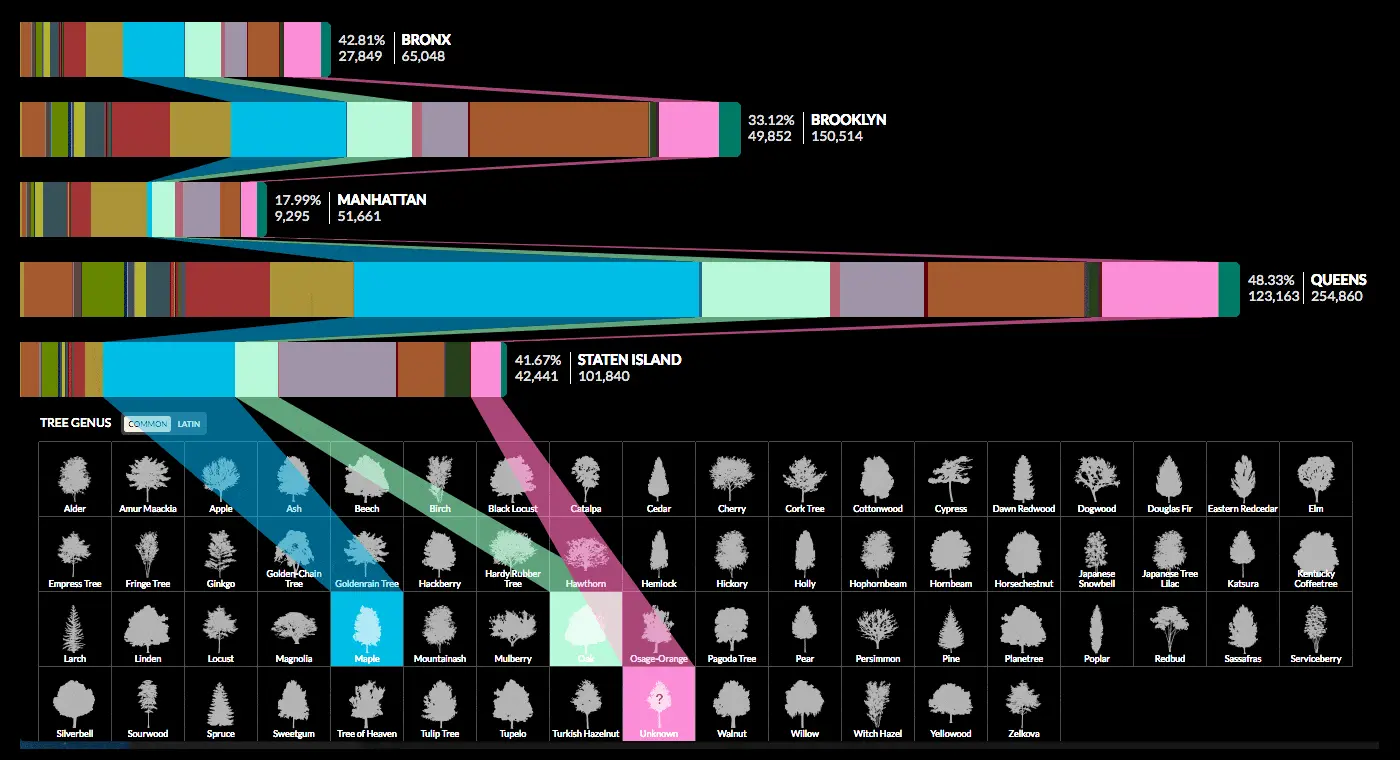
Interactive chart reveals the diversity of NYC’s street trees

Just as New York’s population is a melting pot of ethnicities, the city’s tree population is just as diverse. A new interactive chart from Cloudred give us a look at how tree genus breaks down across the five boroughs. As seen above, if one zooms in on the largest chunks of graph across Manhattan, Queens, Brooklyn, Staten Island and the Bronx, it becomes quickly apparent that maple, oak, pear, and planetree trees have their roots firmly planted in the ground—as do a bunch of “unknowns,” which account for about 14 percent of the city’s total tree population.
Cloudred’s reasons for creating the chart are both novel and scientific; as the makers write on their site: “We were curious to see what were some of the common and not so common trees planted in the five boroughs of New York City. While this visualizes trees, which we personally love as an essential element of any urban city, we see this as an experiment or model to visualize other datasets in an additive/subtractive format. This visualization allows one to quickly see distribution.”
They add that the straightforward layout makes it easy to determine possible threats related to genus dominance. “With such high concentrations of certain trees, there is a risk of a pathogen, insect or environmental stress wiping out a large amount of trees,” they say.
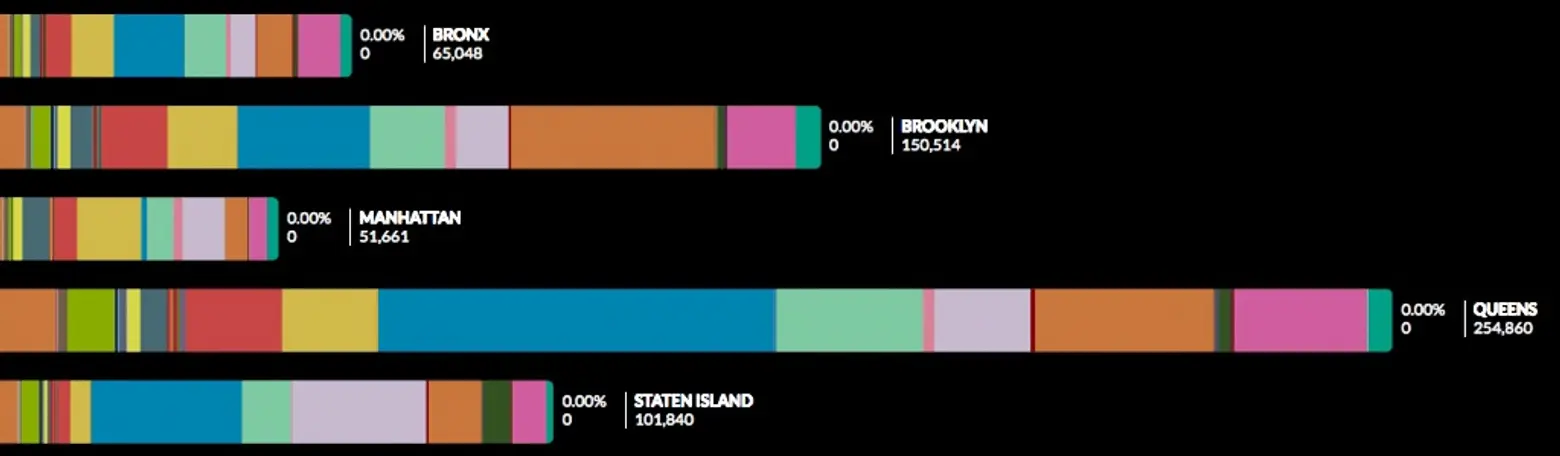
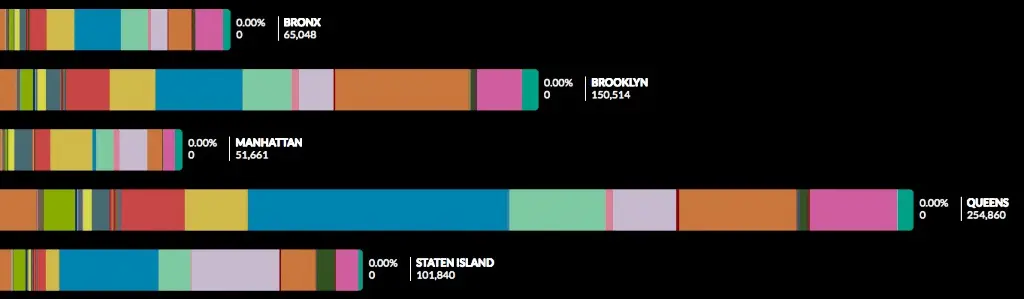
But beyond tree variation, the map also reveals more simply that tree coverage is seriously lacking in Manhattan and the Bronx, particularly when compared to Brooklyn and Queens. By the map’s account, Brooklyn has about 100,000 more trees than Manhattan, while Queens counts over 200,000 more.
Cloudred used stats from NYC Open Data to come to their conclusions.
Explore the chart for yourself here >>
RELATED: