Subspotting Map Project Shows Where You Can Get Phone Reception in the Subway

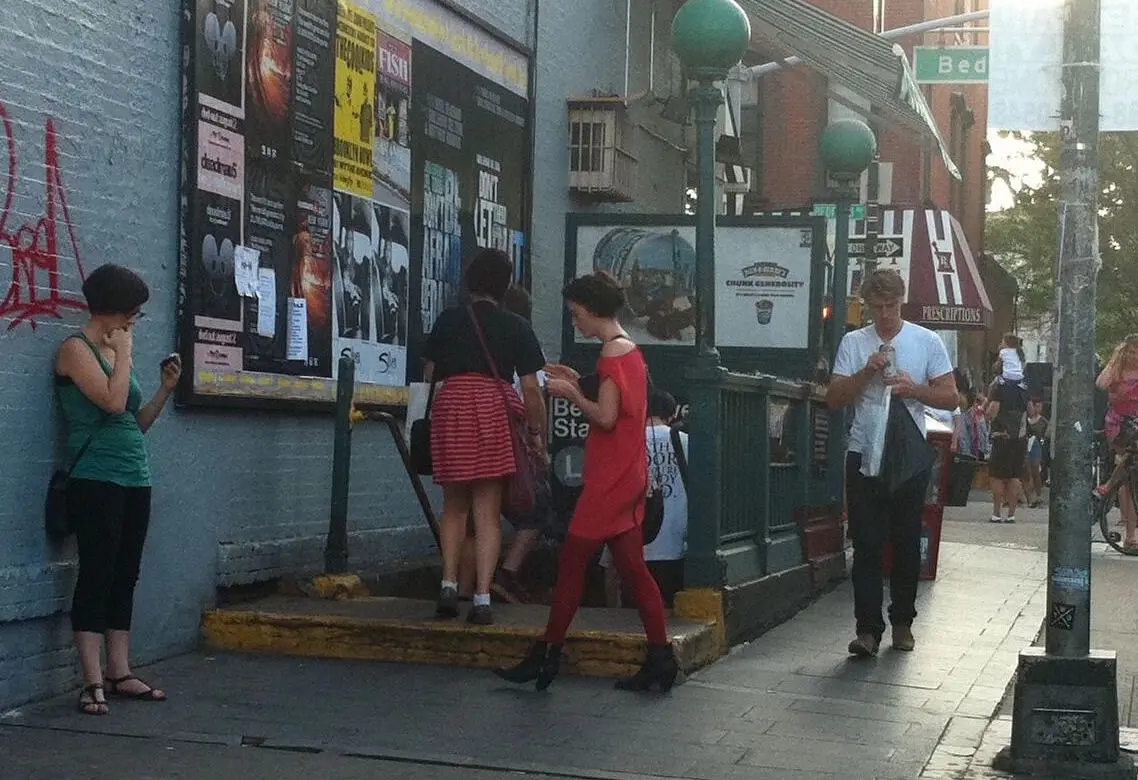
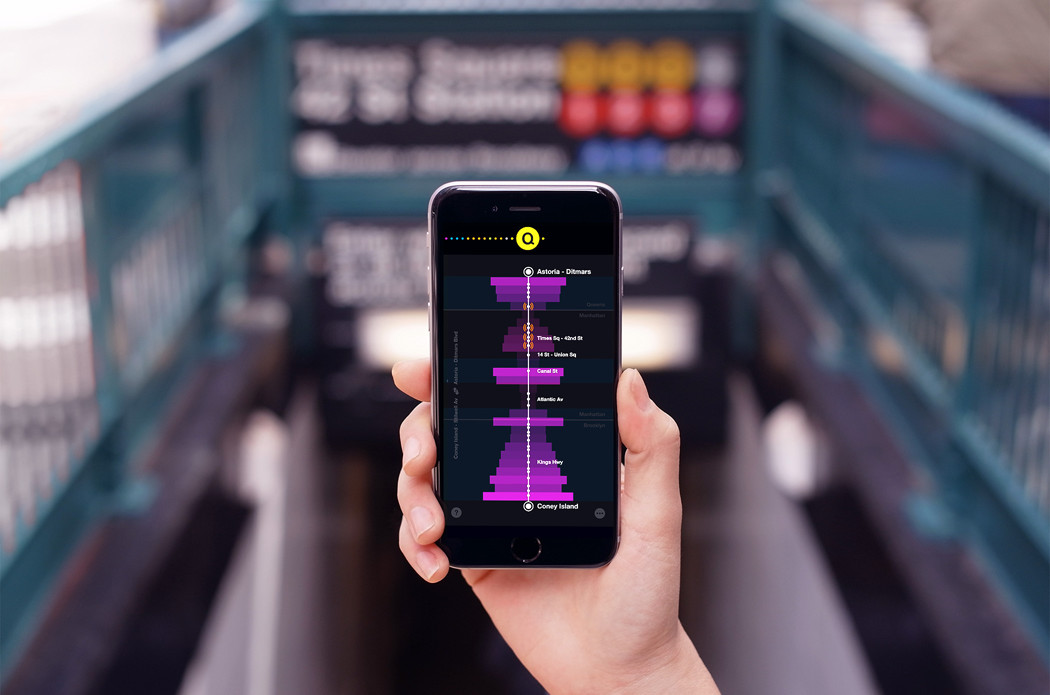
The MTA is apparently well into the middle phase of its project to wire 279 below-ground subway stations with cell reception, but as Citylab recently put it, “there are still places you can’t make a call to save your life.” Into this unfortunate void comes the Subspotting project, brainchild of Daniel Goddemeyer and Dominikus Baur, which offers maps “illustrating the unequal geography of subway reception” and helpfully providing information on where you’ll be able to make a call or send a text while in transit. In addition to system and individual line maps, there’s an app that shows the quality of reception as different sized bars at each station, and MTA-sanctioned posters.
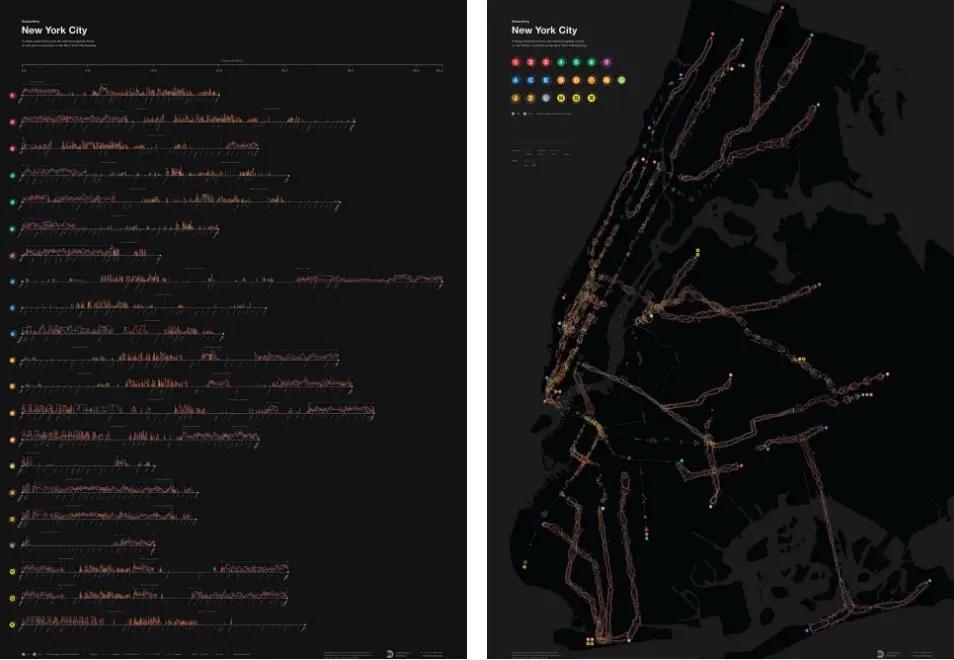
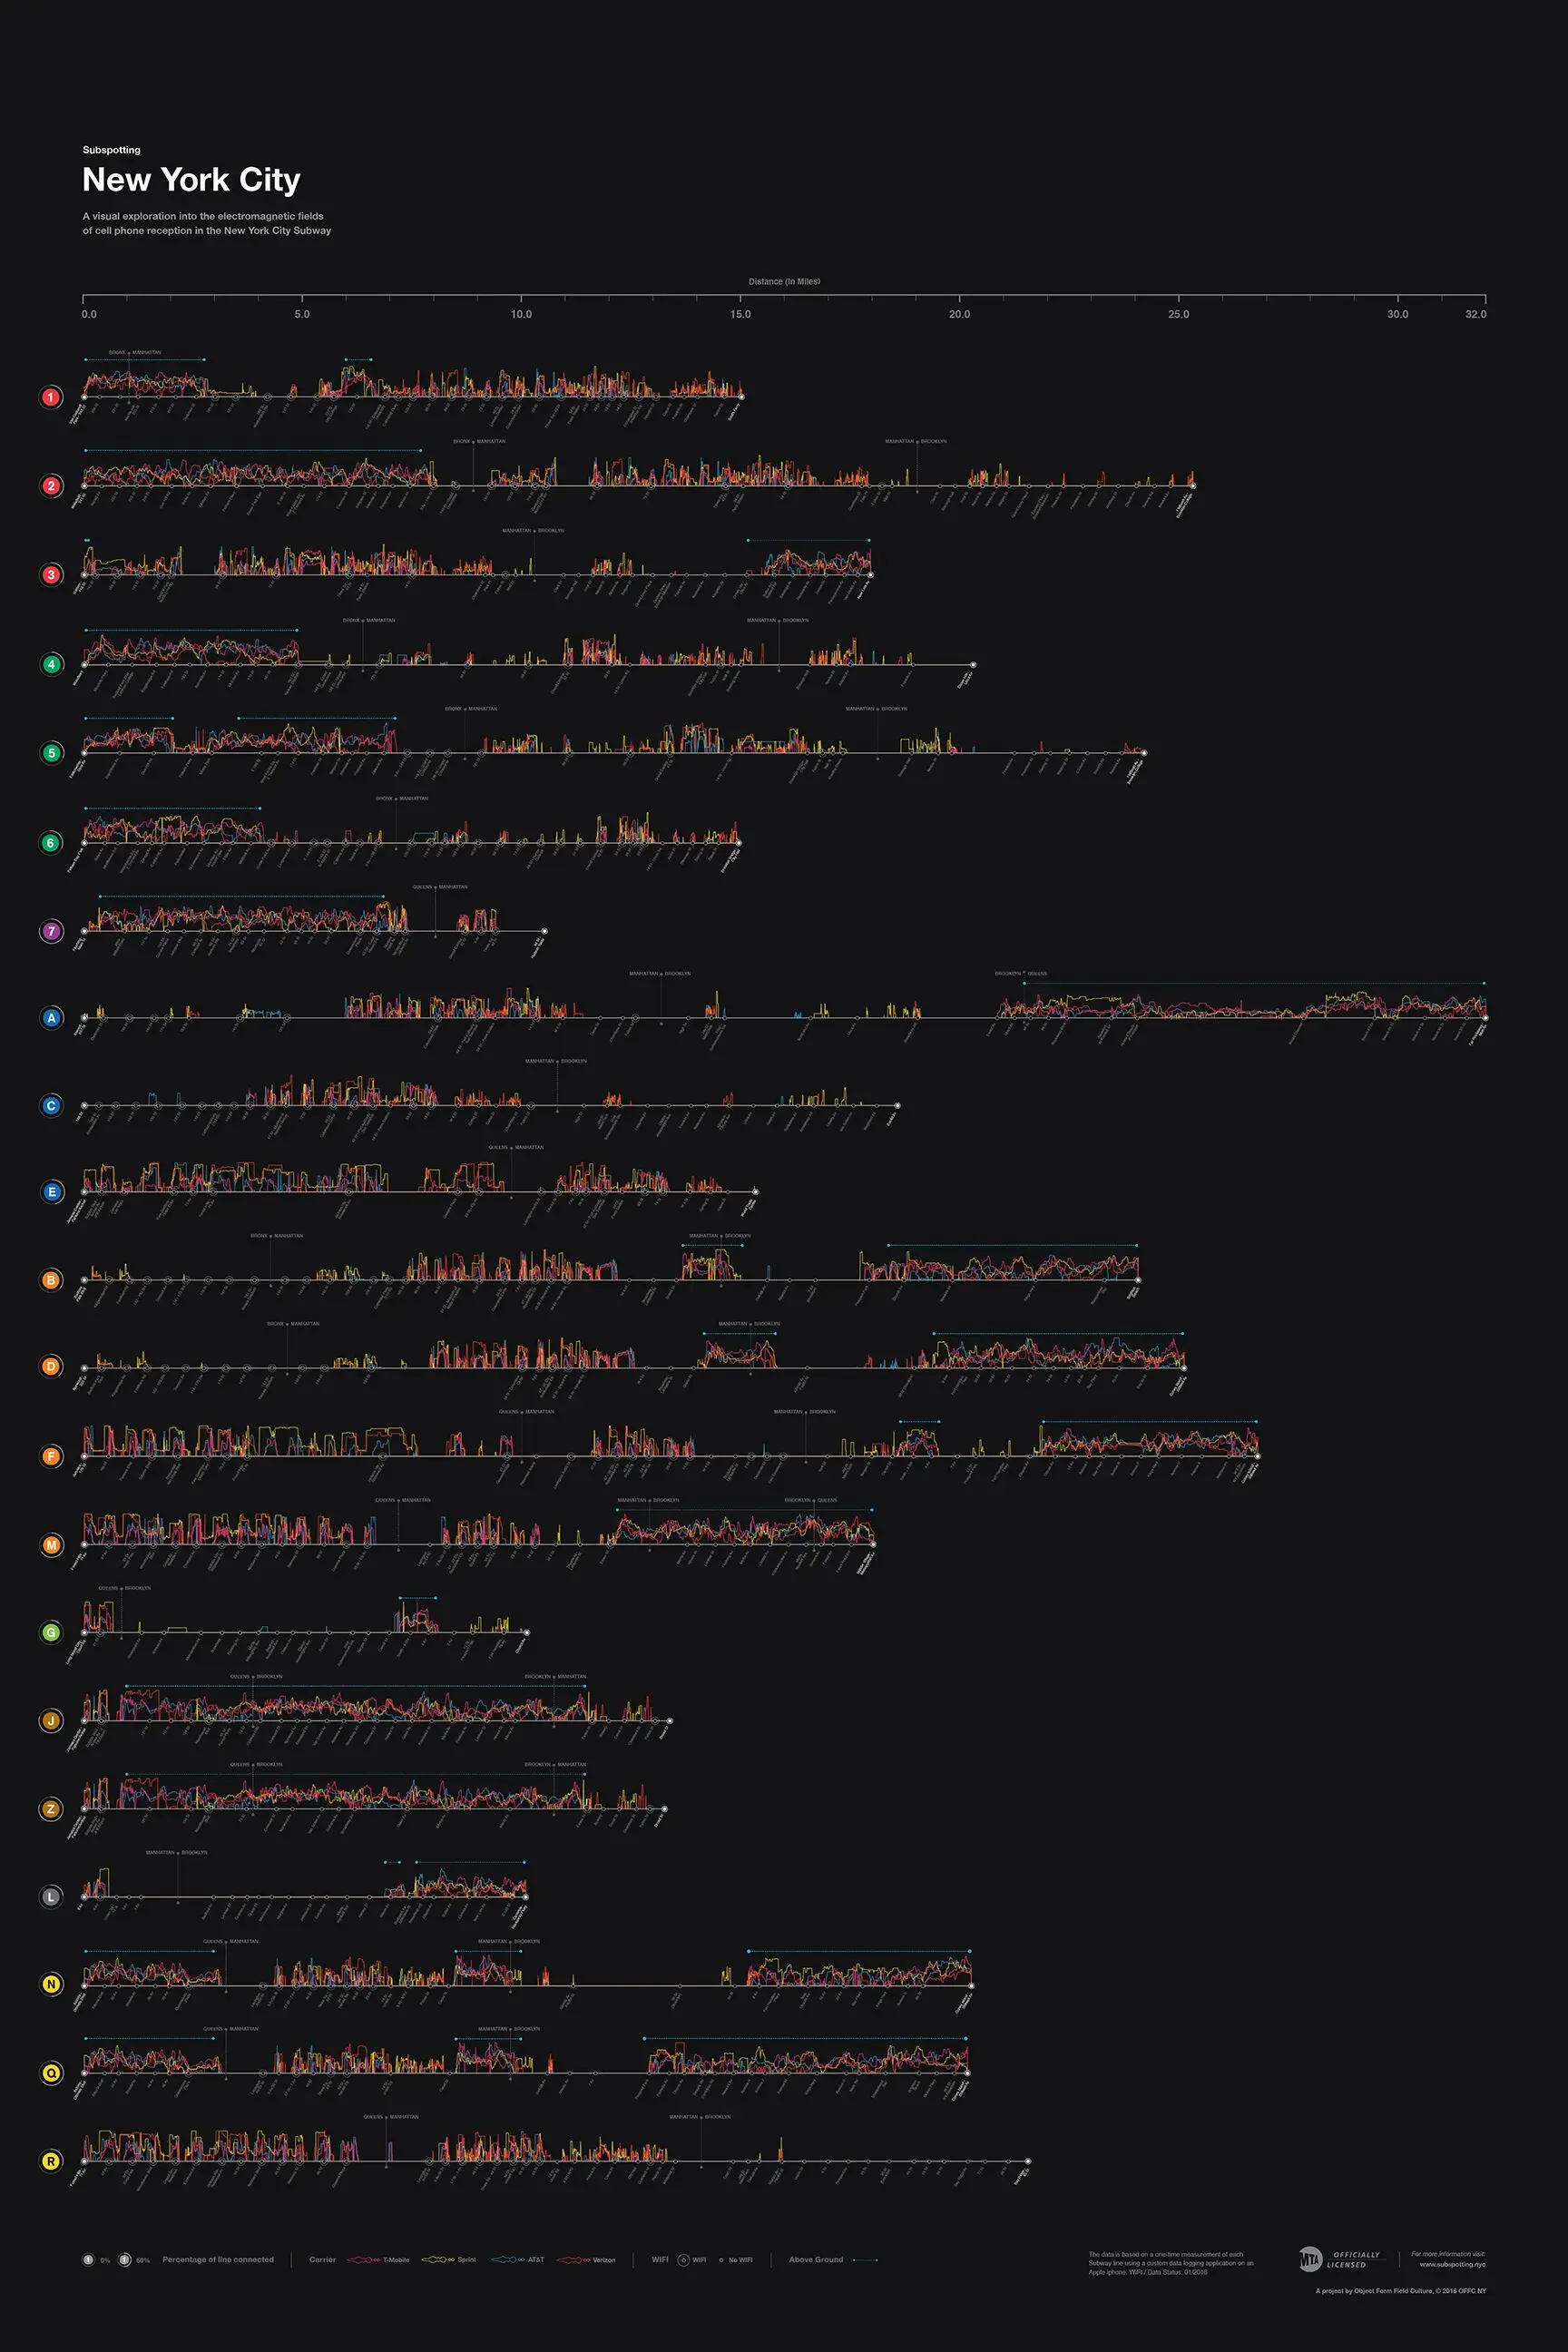
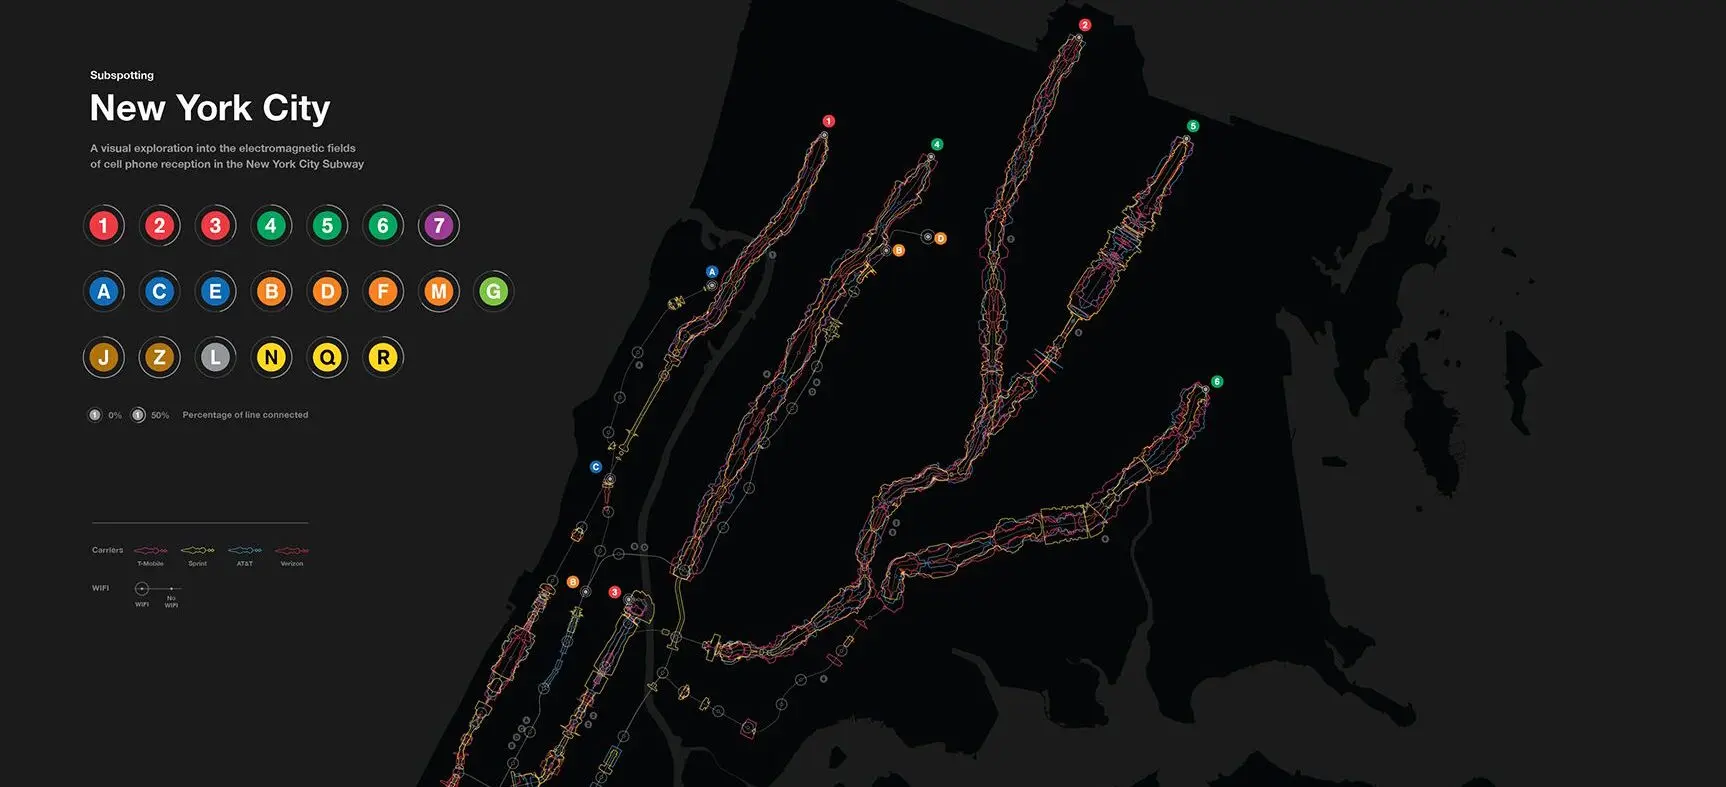
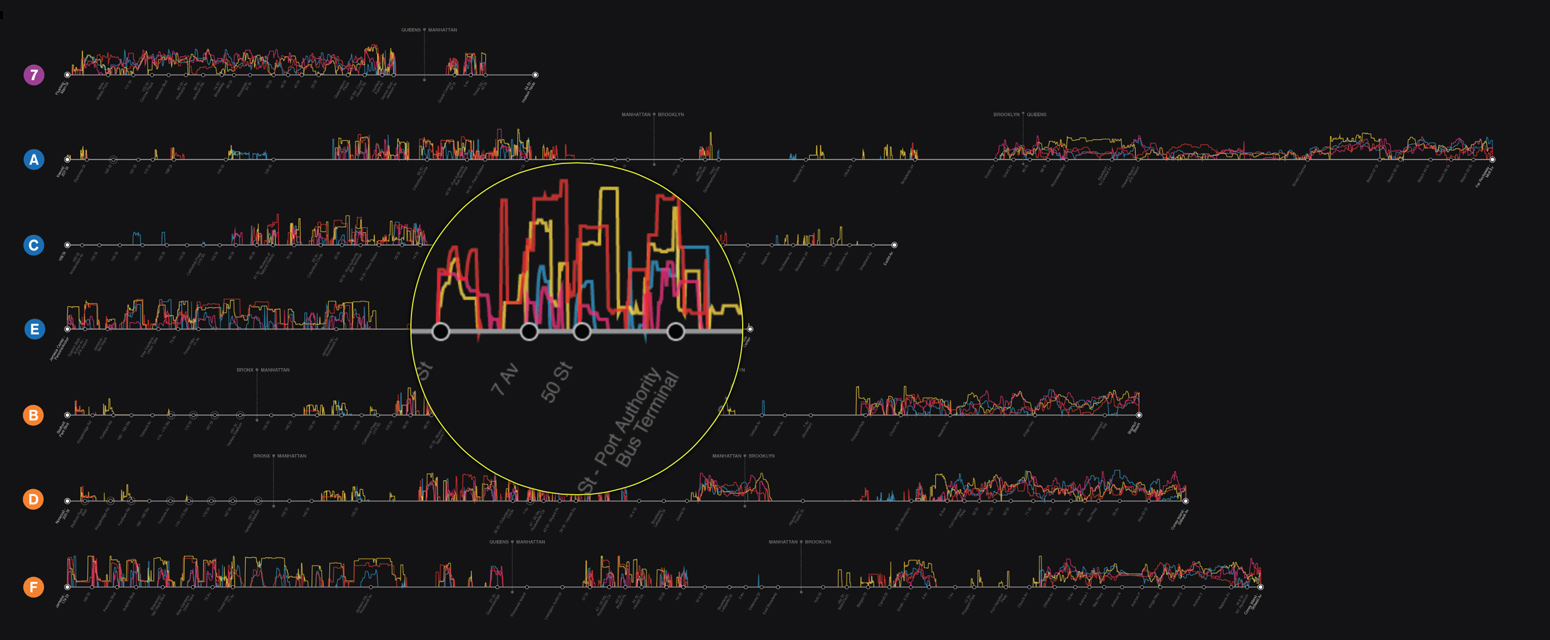
The project’s founders say it’s the first of its kind to map and visualize the cell phone reception available on all of the subway’s 21 lines, 469 stations and 660 miles of track. According to their press release, the Subspotting project logged the cell phone reception of New York City’s four biggest phone carriers (Verizon, AT&T, T-Mobile, and Sprint) across all 21 lines, 469 stations, and 660 miles of MTA track over a period of two weeks.

Click map to enlarge
The result is a map that gives us a visual overview of the electromagnetic fields of New York City’s underground transit system, highlighting the system’s dead spots, areas of spotty signals and available patches of connectivity, along with an app to get the info to go. It’s also available as a colorful poster for $40.
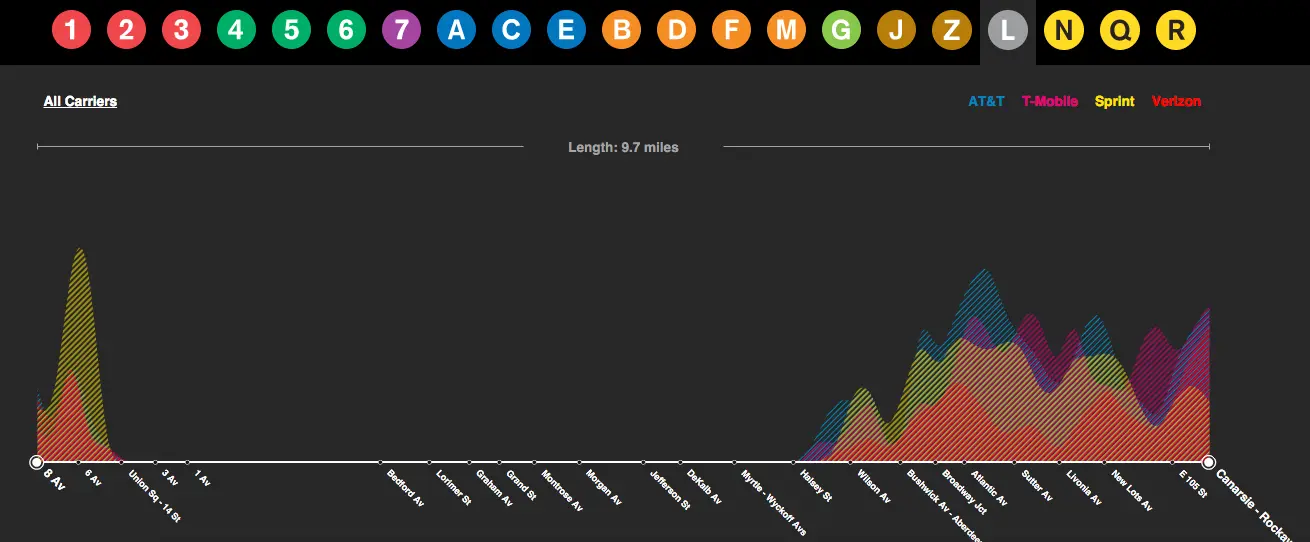
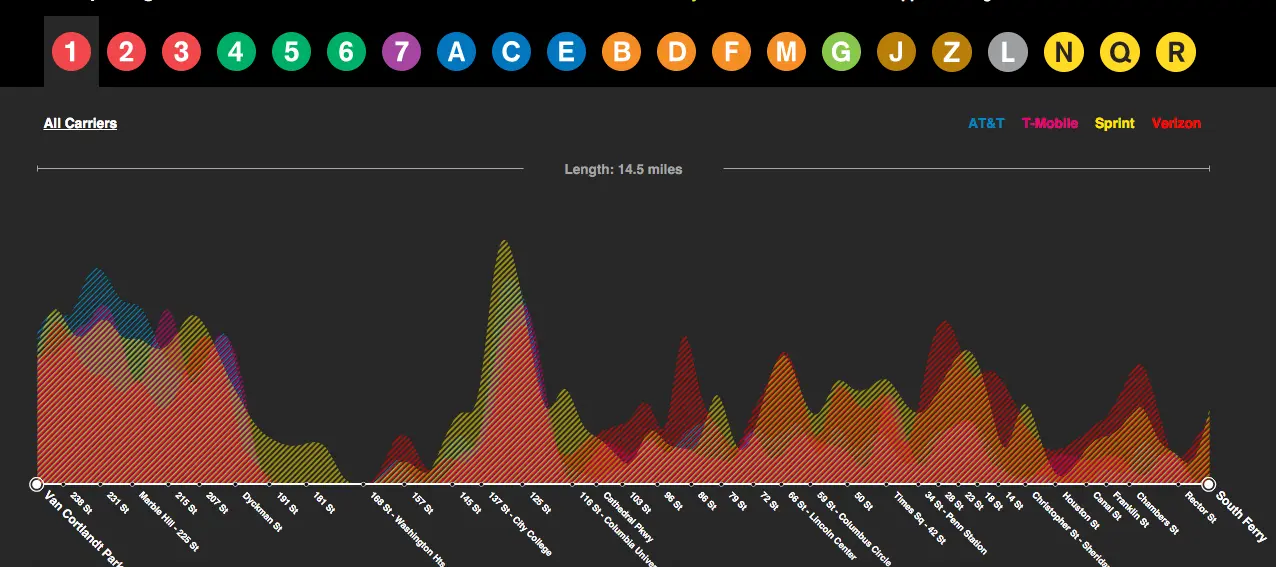
On the project site, you can select your subway line and find out where you can get service, on which carrier, and how strong the signal is.
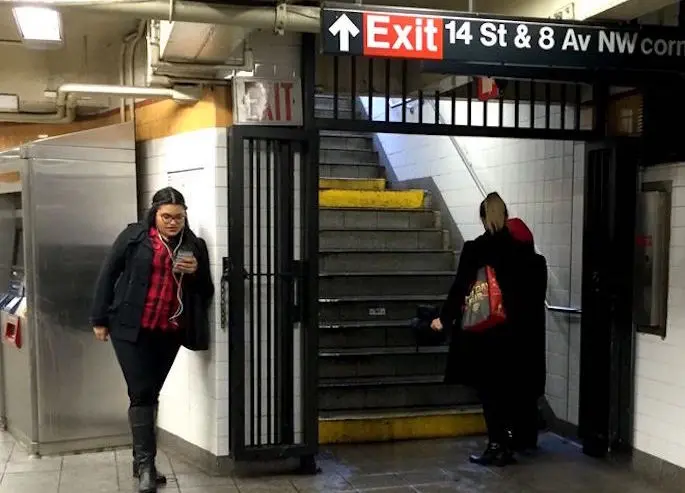
So which lines do the best job in keeping riders connected? The Subspotting team found that, for example, the 7 and J lines had the highest level of coverage overall (79 and 75 percent, respectively); the G (surprise!) was the worst at 12 percent. The strongest reception on the L train could be found at 8th Avenue and 6th Avenue.
Here’s a video on the how the Subspotting project unfolded:
[Via Citylab]
RELATED: