New Mapping Tool Urban Layers Tracks the Age of Every Building in Manhattan

A new mapping tool called Urban Layers lets users see almost every building still standing in Manhattan today and reveals exactly when it was built. The data goes back as far as 1765. The interactive map by Morphocode provides insight not only into the history of a specific building, but into the evolution of entire neighborhoods, too. And for New York City history fanatics like us, this user-friendly tool is definitely going to come in handy.
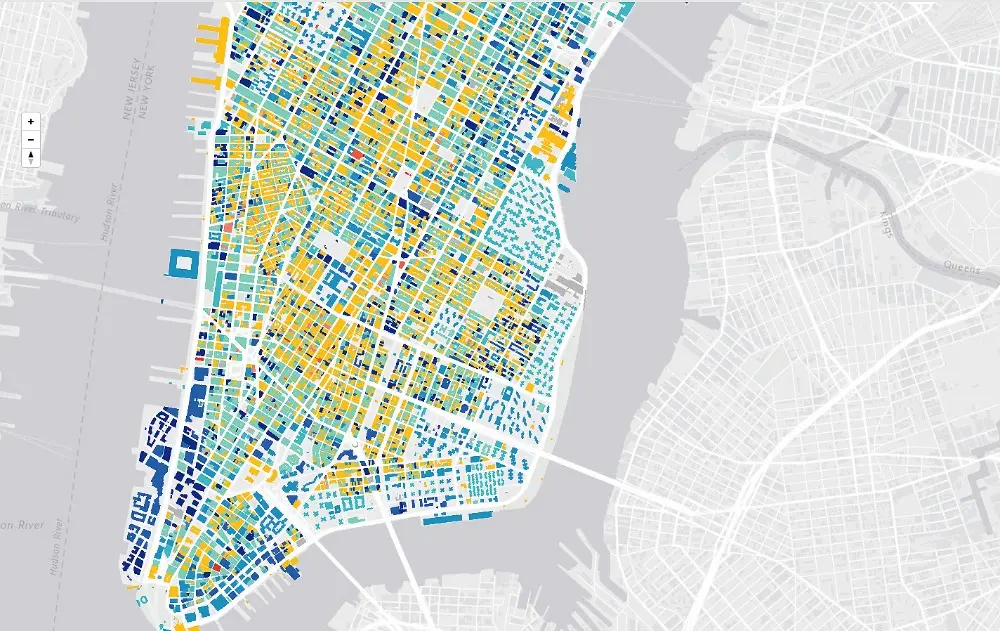
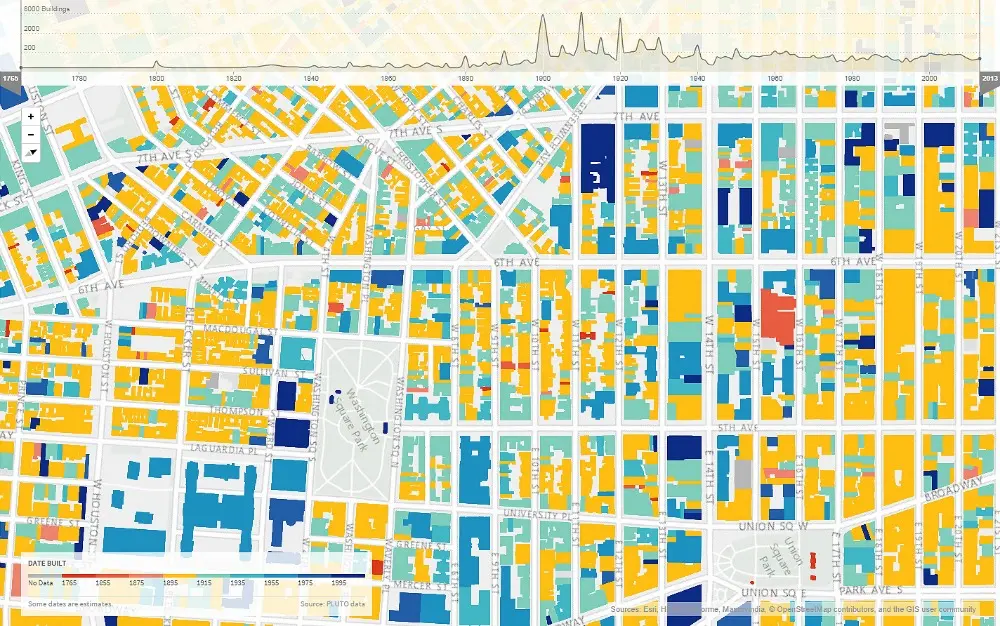
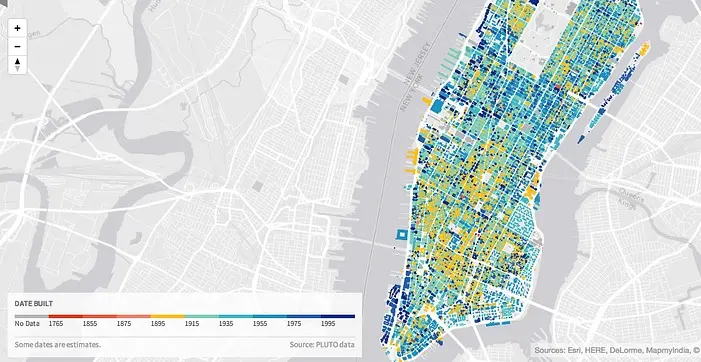
 Buildings in Lower Manhattan colored by age
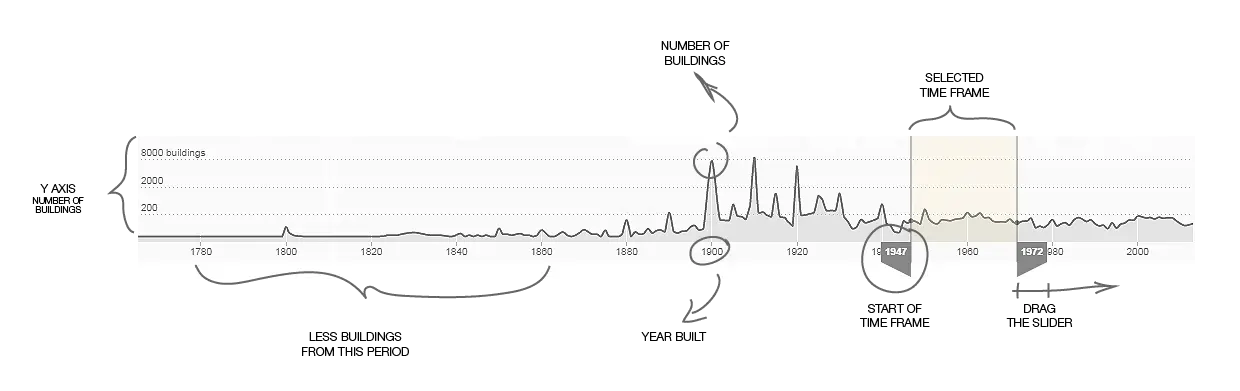
 An explanation of the slider graph used to select data
Since the 1811 Commissioners’ Plan for Manhattan laid out the orthogonal grid of 2,028 blocks we know today, a huge building boom occurred between 1810 and 1900, the period that Urban Layers focuses on.
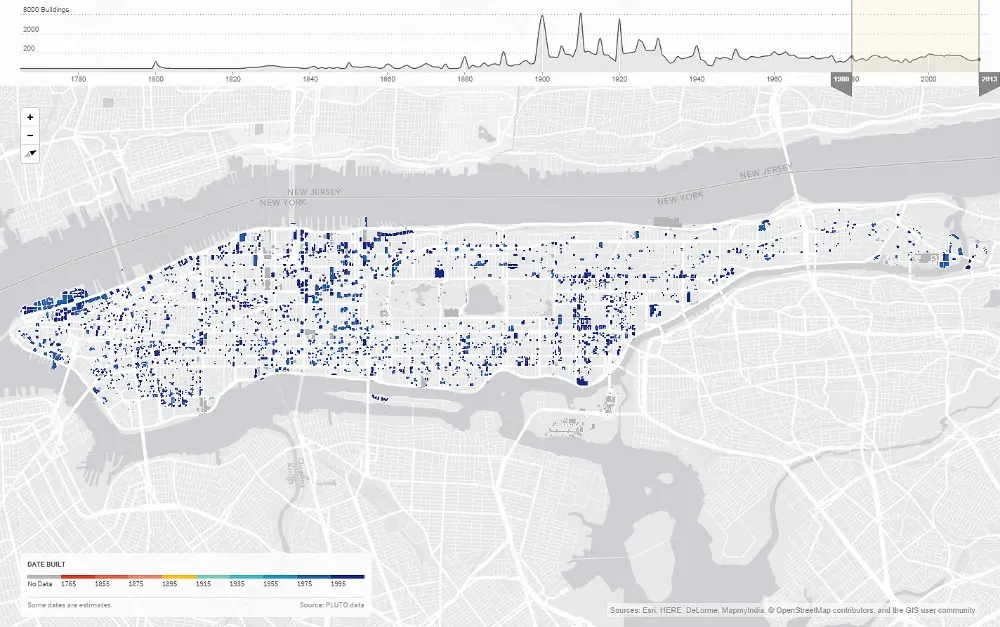
 Buildings in Manhattan built after 1980
Urban Layers is based on two data sets: PLUTO, data released by the city in 2013 that provides information about every building in New York, including year built, height, and zoning; and NYC Building Footprints, which provides the shape of building footprints throughout the city.

Morphocode is an architectural practice working at the intersection of design and technology. The firm explores how urban visualizations can provide valuable insight into how cities perform and how people interact with their environment. You can get started with Urban Layers here.
[Via CityLab]
Images courtesy of Morphocode