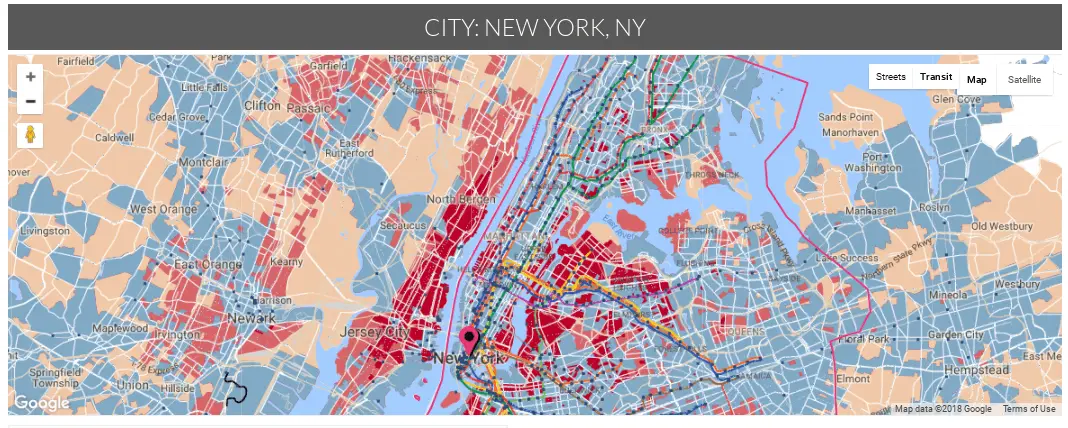
Interactive map identifies the New York City neighborhoods most underserved by transit

Map via AllTransit
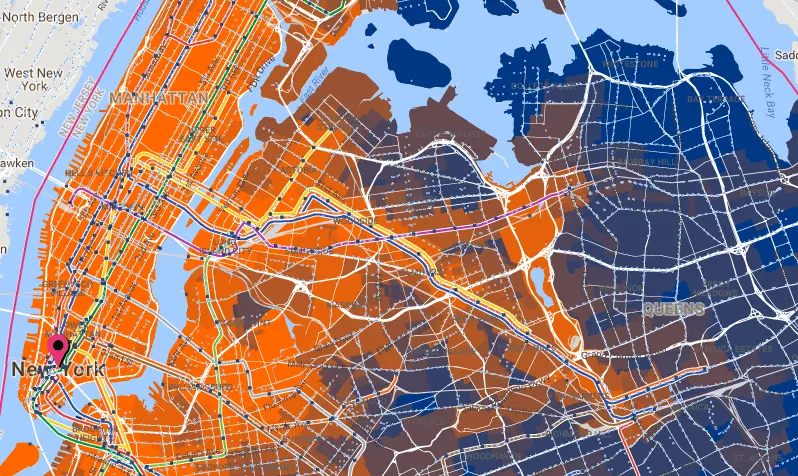
Nearly 29 percent of New York City households are underserved by transit, according to data from the Center for Neighborhood Technology and TransitCenter. In a joint project, called AllTransit, the team put together a collection of transit data that includes 15,000 routes and 800 agencies in the United States. A tool called Gap Finder identifies gaps in U.S. cities where underserved communities would benefit from improved service.

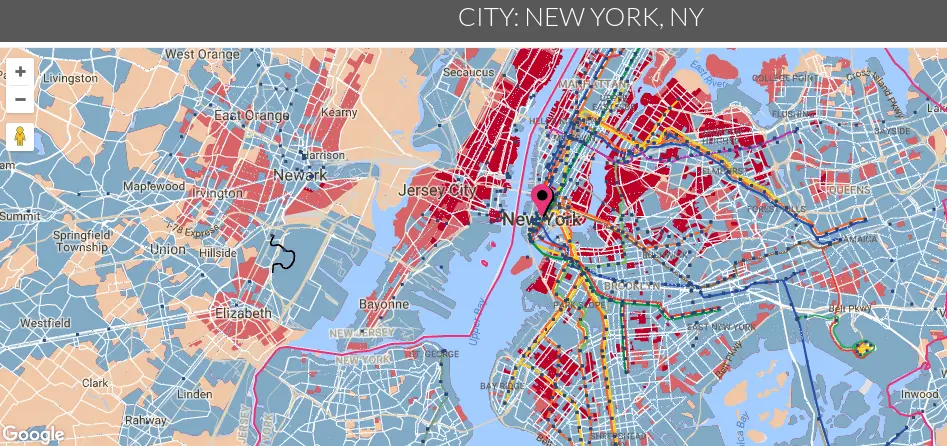
A transit gap exists when there is an imbalance between the demand on the market and the quality of service. The map allows users to enter an address, city, state or zip code to discover which areas do not have equitable access to public transportation. The blue areas represent transit markets with adequate service. The areas with inadequate service are shaded with orange and red, depending on the need for transit improvements.
According to the data, if the average wait time for transit is reduced by 6 minutes in underserved neighborhoods, NYC would meet the minimum expected standard. AllTransit suggests increasing the frequency of transit service along the existing 13 routes or adding new routes as well as adding 30 rides every hour to close the gap for these disproportionately affected neighborhoods.
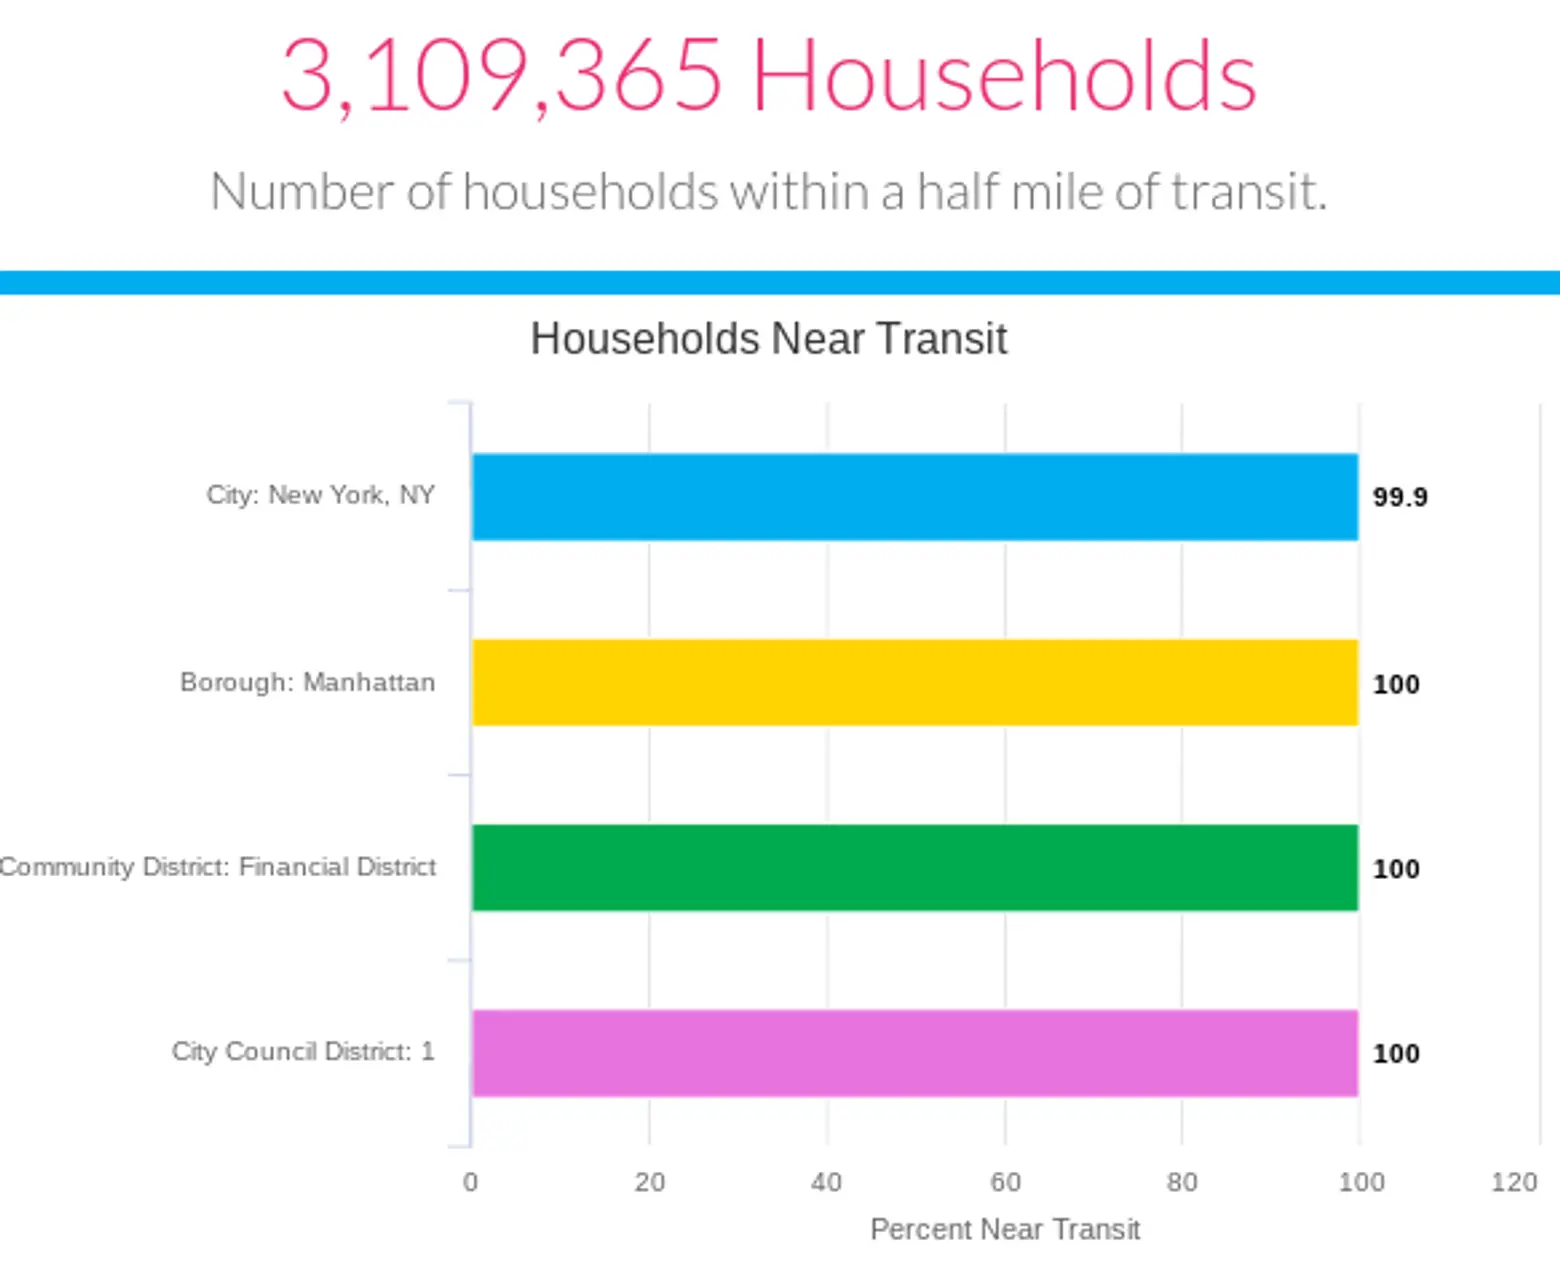
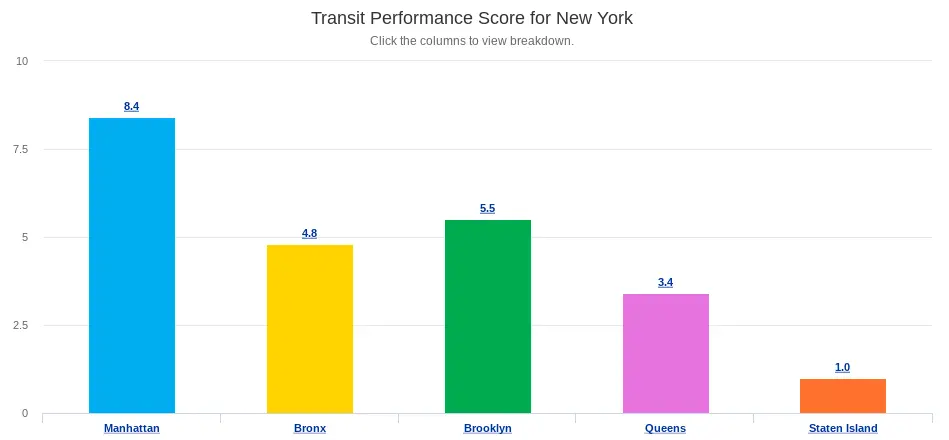
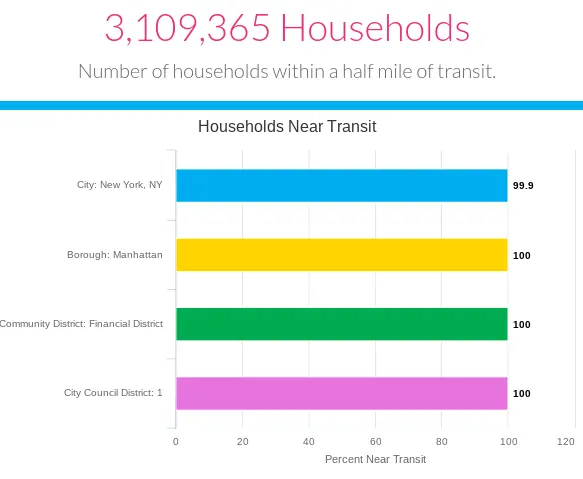
AllTransit also released a fact sheet that details a city’s performance score, the number of jobs near transit and the access of transit to customers. Overall, NYC scored pretty well with a 9.6; over 99 percent of jobs are located within 1/2 mile of transit. Notably, 100 percent of Lower Manhattan neighborhoods, like the Financial District, is located within 1/2 of a mile to transit.
Underserved neighborhoods found in Brooklyn unsurprisingly include Red Hook, Greenpoint, Dyker Heights and East Flatbush. Manhattan’s West Side and the East Village are labeled as inadequate on this map.
![]()
The group ranked major cities by their performance score, which is found by looking at a city’s connectivity, access to jobs and frequency of service. With a score of 9.6, New York comes in second just after San Francisco. However, Newark ranks tenth.
Explore the Gap Finder tool further here.
RELATED: