Chatty Maps Tell You What You’ll Hear on Given Streets and How It’ll Make You Feel

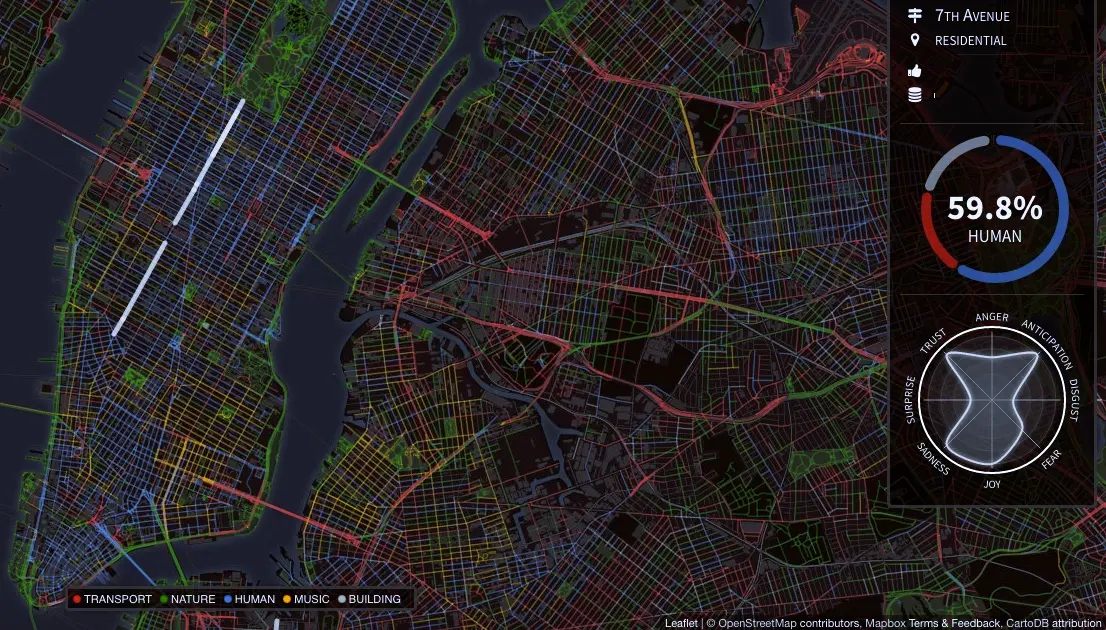
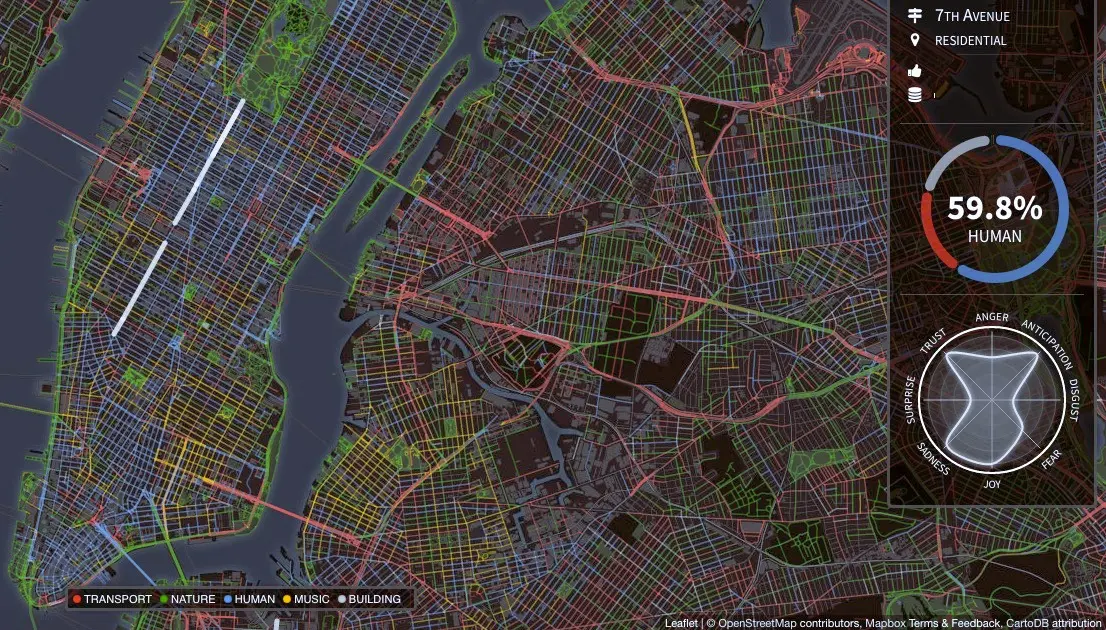
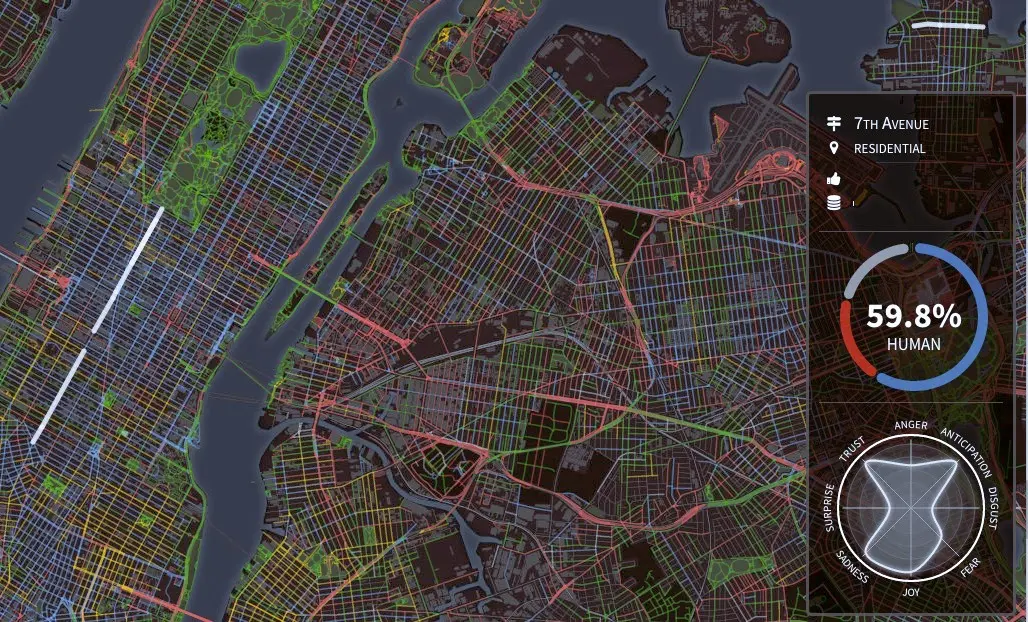
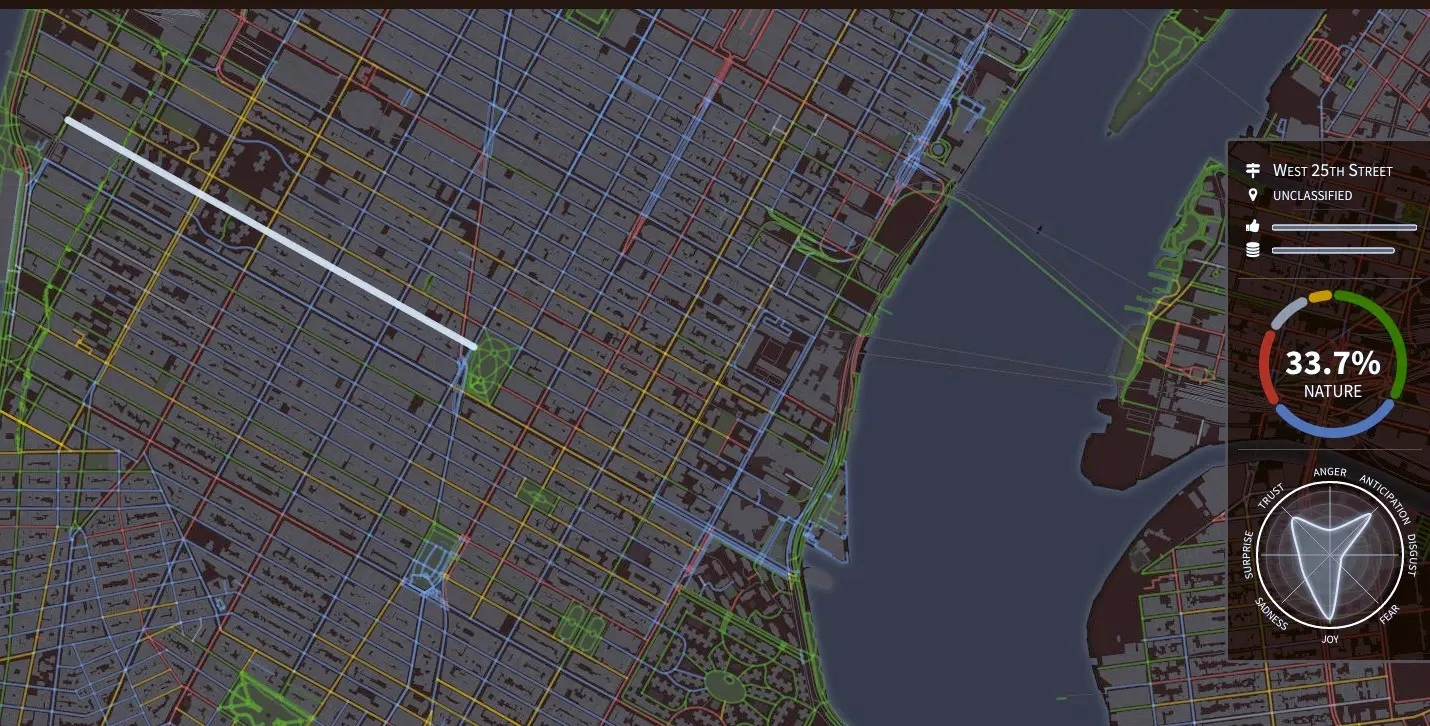
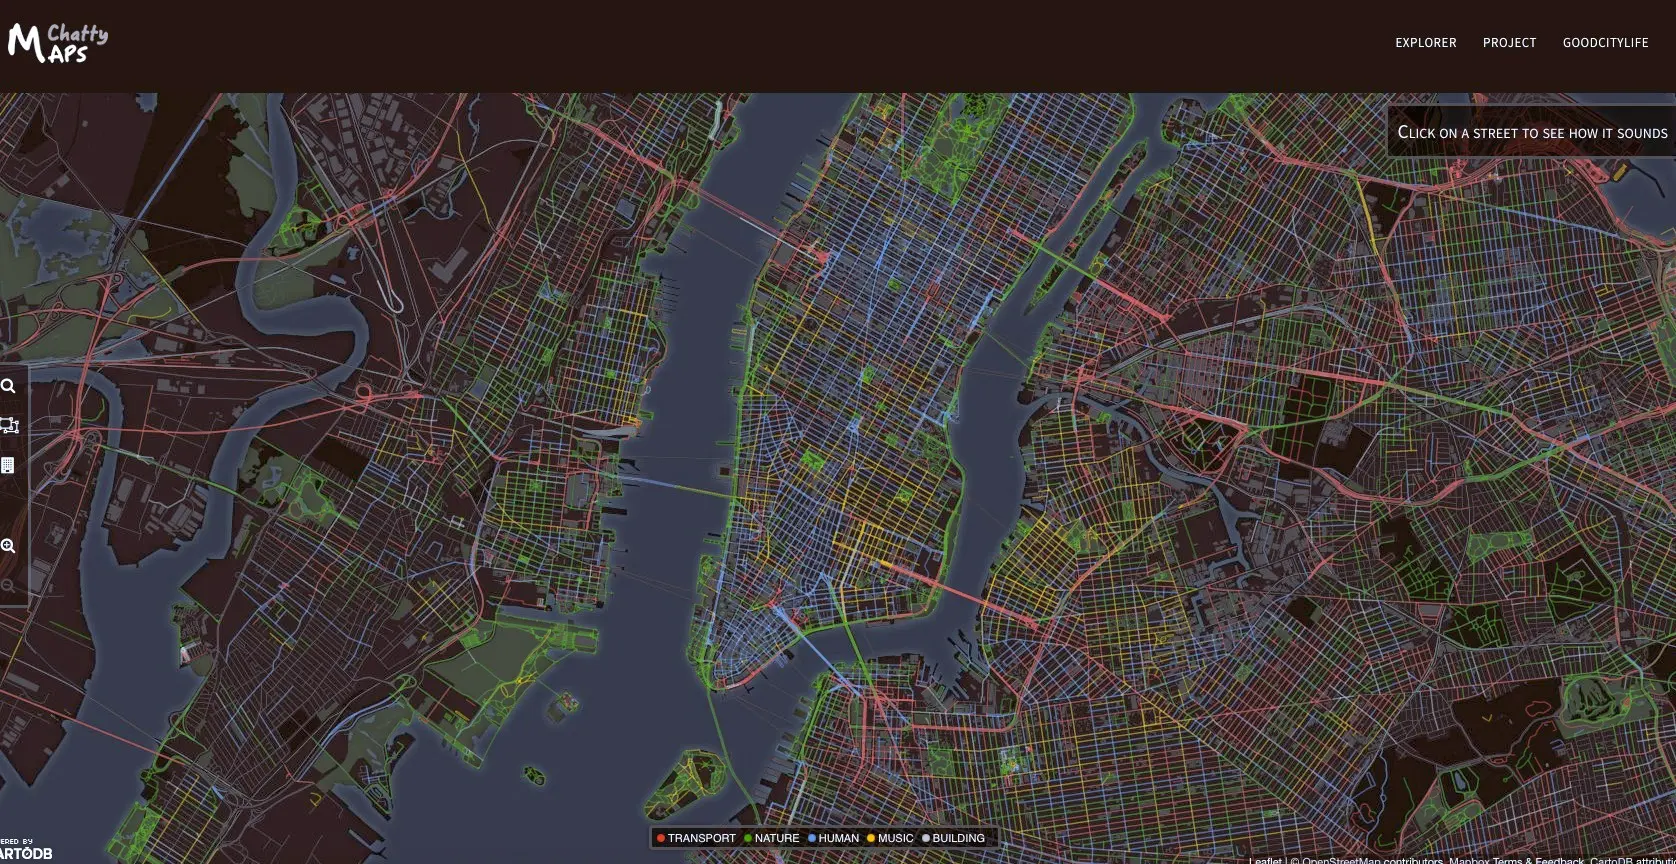
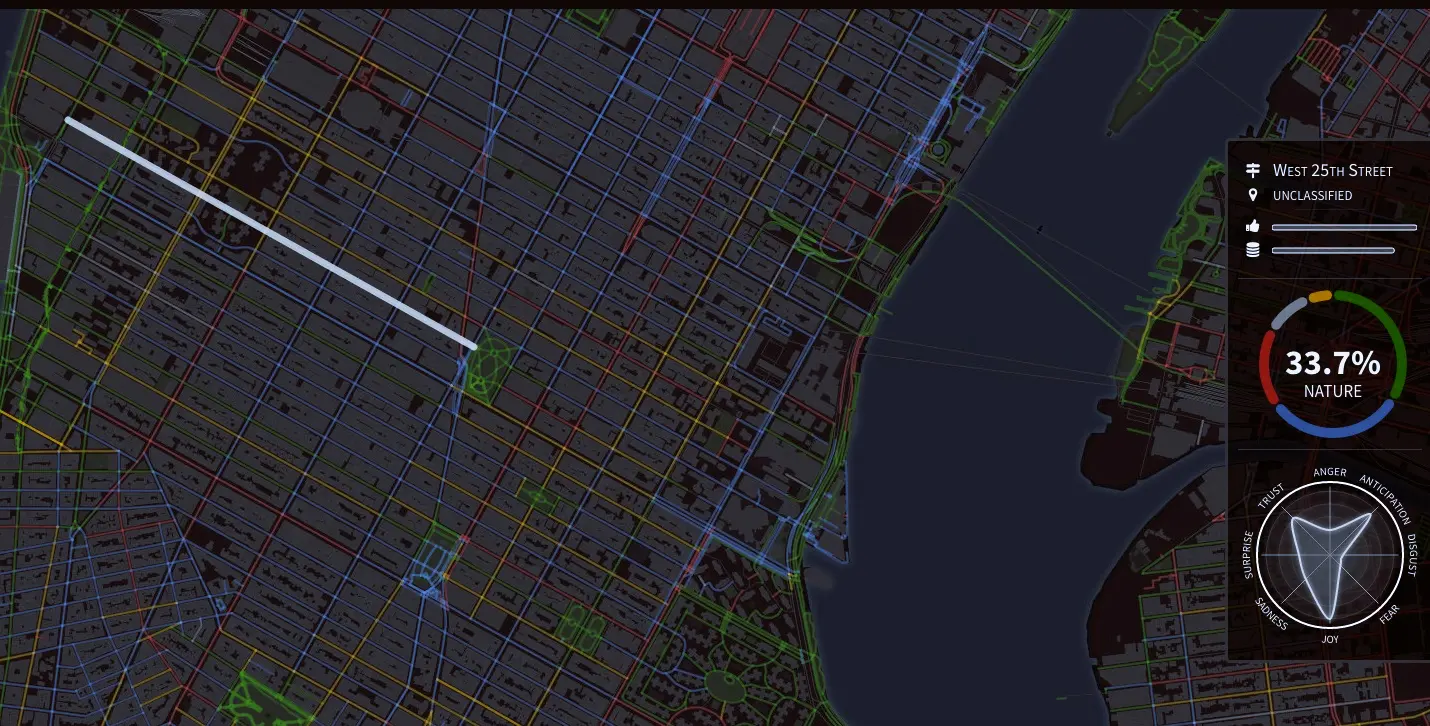
Chatty Maps is an interactive project that reveals what sort of experience your ears will have on specific city streets. Leaflet-based maps of New York, San Francisco, Chicago, Boston, Washington, Miami, Seattle, London, Barcelona, Madrid, Milan and Rome map each city’s roadways, which are colored to correspond to sounds on the street (transport, nature, human, music and building), based on tags taken from social media.
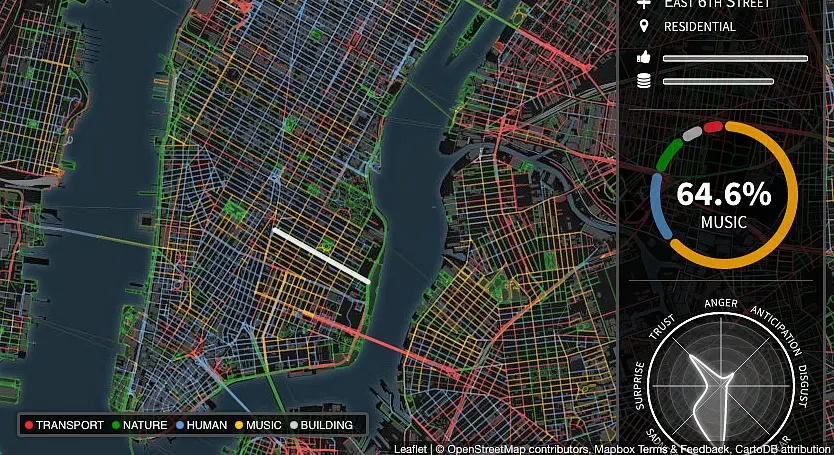
Select your city and find a street on the map (or search for the street of your choice) to view the corresponding sounds. For each street, you also get a data visualization that attempts to track the relationship between street sounds and human emotions. Streets with dominant music sounds, for example, are associated with strong emotions of joy or sadness.
The attempt to decode the city at both the ground level and the human level is business as usual for the research and data company Goodcitylife, a global group of researchers and practitioners who “think about fundamental urban problems that have received little attention and put forward ideas not to make cities smarter, but dwellers happier.” They explain the importance of Chatty Maps as a way to capture general urban sounds both pleasant and unpleasant at city scale using “a new methodology that relies on tagging information of georeferenced pictures,” rather than just being concerned with complaints about annoying noise. In studying the relationship between soundscapes and people’s perceptions, they’re able to map “which areas are chaotic, monotonous, calm, and exciting. Those insights promise to inform the creation of restorative experiences in our increasingly urbanized world.”

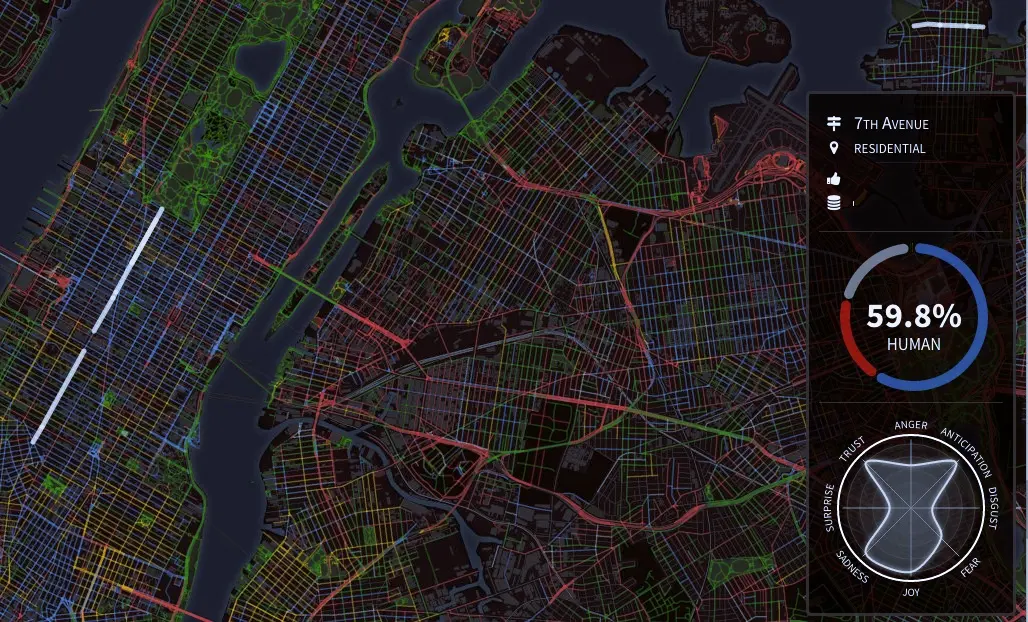
In our search, the dominant sounds on busy Seventh Avenue are 59 percent human, and 19 percent transport, which actually sounds about right. The slightly menacing-looking corresponding emotional diagram tends toward trust, anticipation, sadness and joy, which pretty much feels like the middle of Manhattan on a Friday morning. We’re impressed.

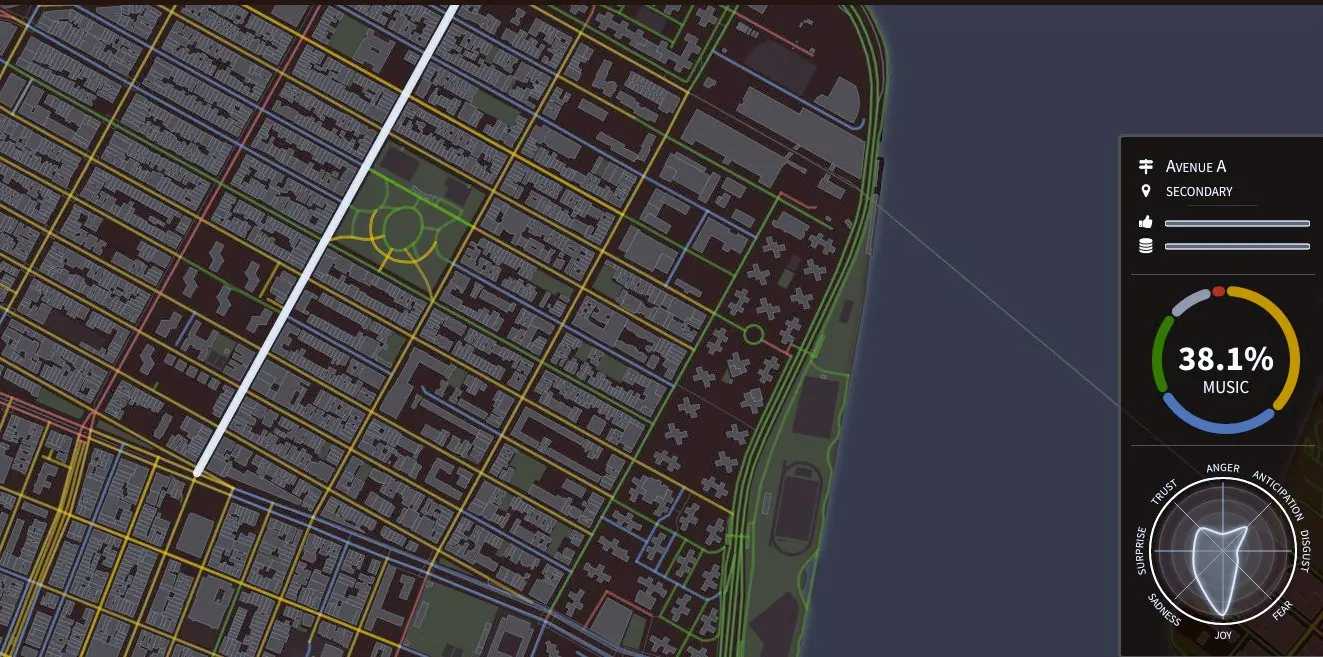
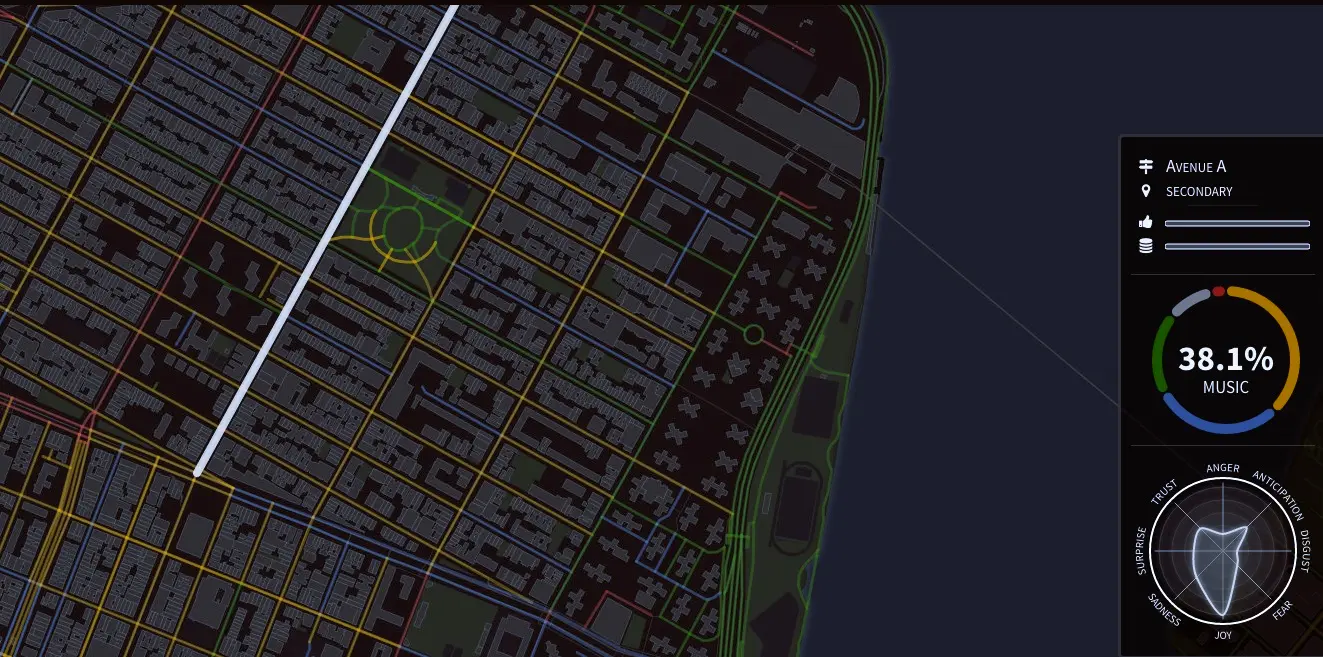
Heading downtown to Avenue A just off Tompkins Square Park, things get musical, with lots of joy.

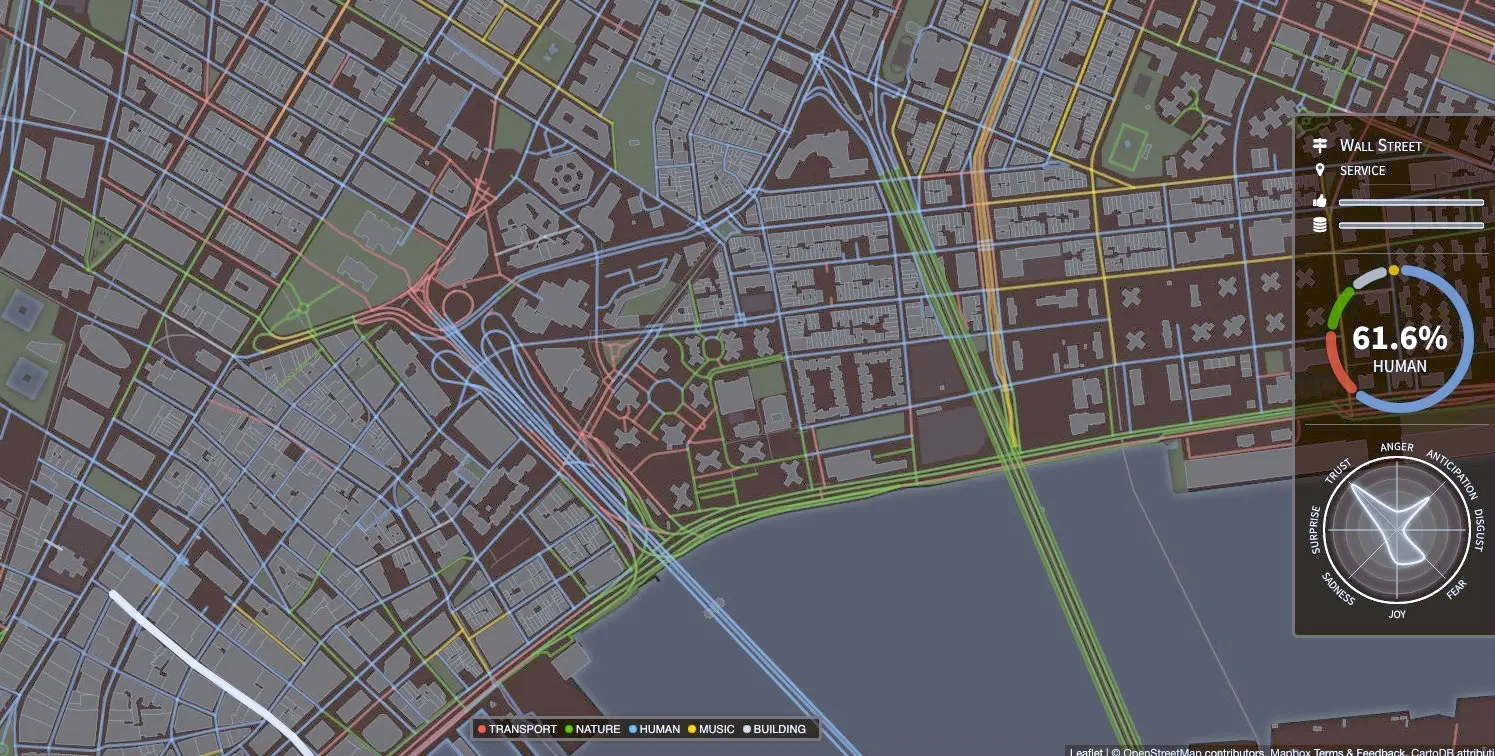
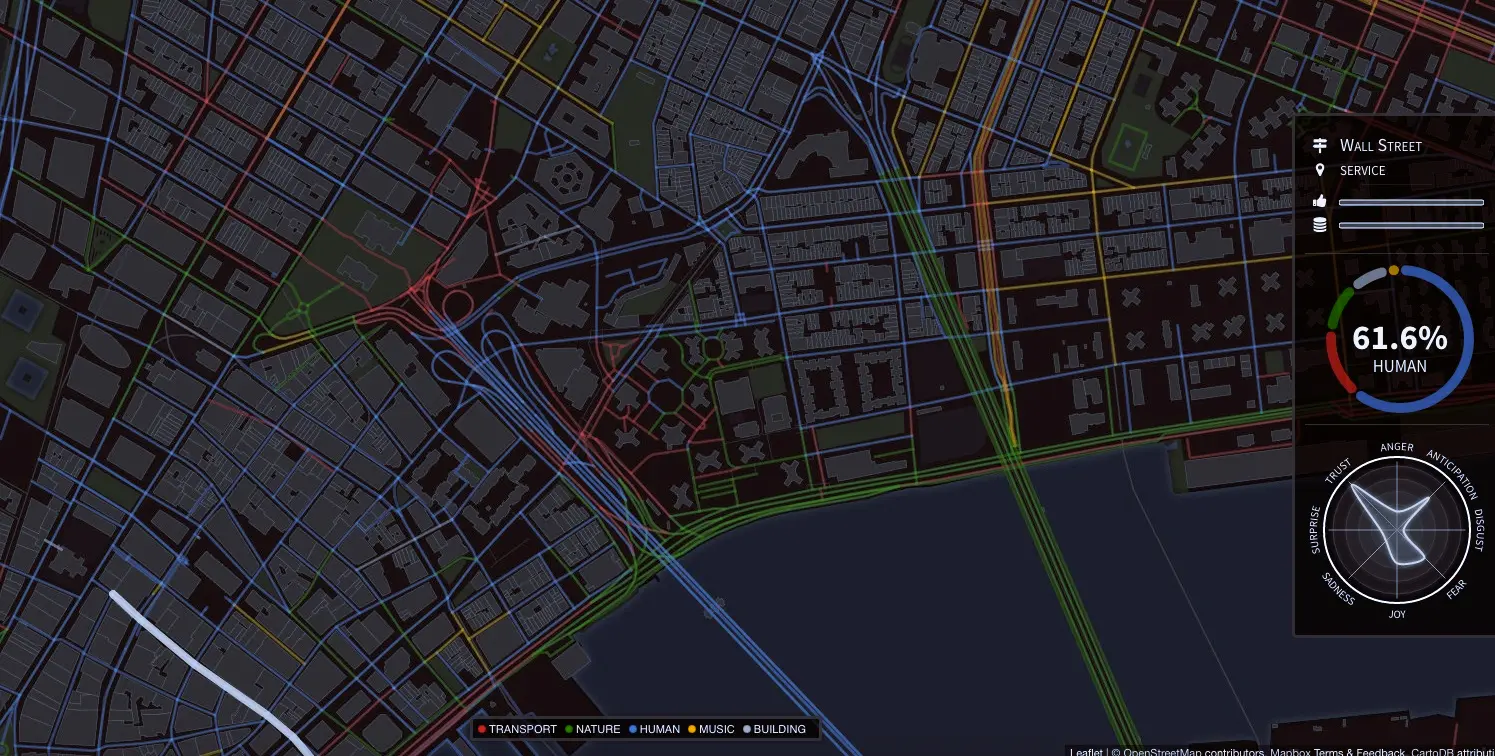
Though the sounds are definitely human down on Wall Street, we’re not sure about all this trust.
Check it out for yourself! And find out more about the project and others like it here.
[Via Googlemapsmania]
RELATED:
- New Map Reveals the Loudest and Quietest Places in the USA, As Suspected NYC Is Noisy
- The New York Music Map Matches 450 Artists With a Special Spot in the City
- What Are New Yorkers Listening To? The Answer May Surprise You
Jackhammering image via Better Productivity Blog