Detailed Infographic Shows the Ebb and Flow of NYC Skyscraper Construction

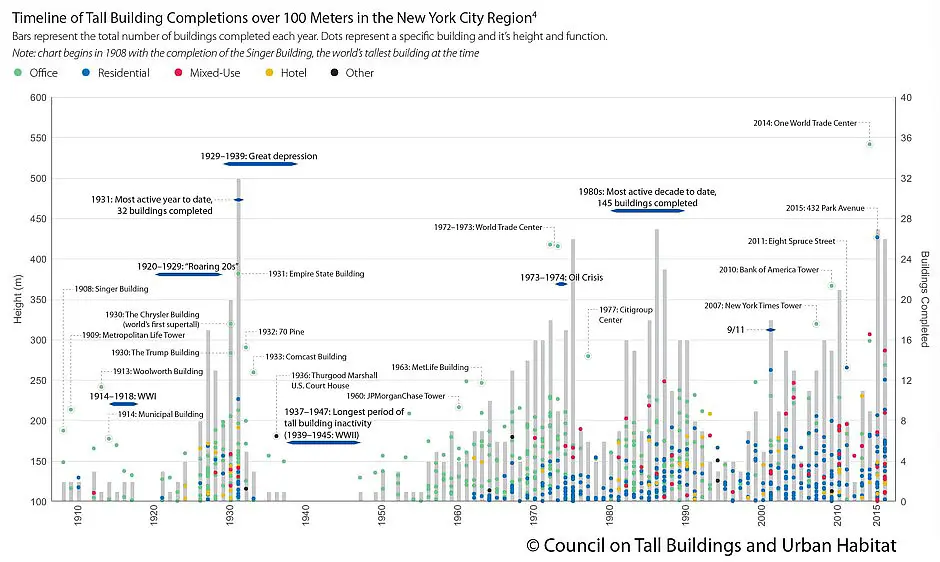
Charts related to skyscrapers typically compare the world’s tallest buildings, but a new interactive timeline from the Council on Tall Buildings and Urban Habitat (CTBUH) shows the ebb and flow of skyscraper construction in NYC and how it resembles the country’s boom and bust cycles (h/t CityLab). The timeline is part of a larger report called “New York: The Ultimate Skyscraper Laboratory,” which also examines the function and location of recent supertall towers going up during today’s boom cycle.
The timeline shows a span of complete inactivity during and following WWII when building materials were scarce. There are also lulls in the 1950s, mid ’90s, and 2008. The year that saw the most skyscrapers completed (32 to be exact, including the Empire State Building) was 1931, “when the final excesses of the Roaring ‘20s were thrown skywards and frozen in concrete and steel.” There was a surge in the ’70s that can be attributed to “the rise of multinational corporations, and the ’80s were the most active decade with 145 buildings completed thanks to the “Wall Street years.” As far as the current boom goes, the report says it “demonstrates New York’s persistence as a magnet for capital, and its standing as the ultimate skyscraper laboratory over time.” By examining the colored dots, we can see that major construction in the new millennium has been mainly residential, whereas prior to the ’70s it was mostly office towers.
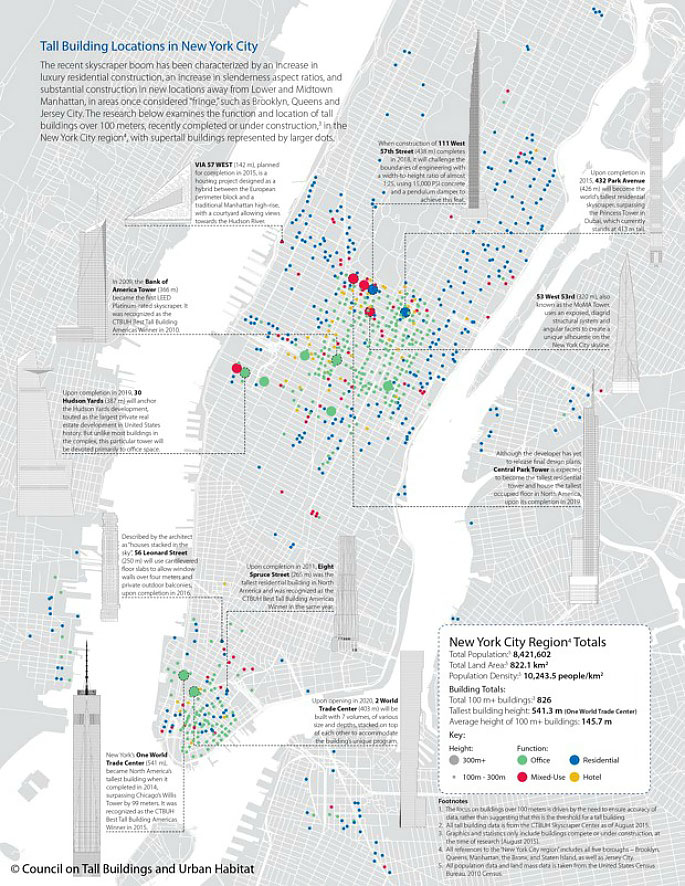
“The recent skyscraper boom has been characterized by an increase in luxury residential construction, an increase in slenderness aspect ratios, and substantial construction in new locations away from Lower and Midtown Manhattan, in areas once considered “fringe,” such as Brooklyn, Queens and Jersey City,” writes CTBUH. In the map shown above (which is also interactive), they plot all tall buildings over 100 meters, representing supertalls with a larger dot.
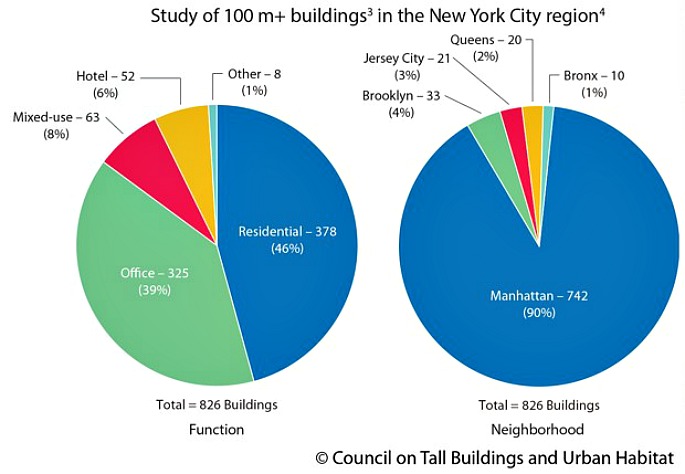
This pie chart shows just how many skyscrapers are residential, and how Manhattan accounts for 90 percent of all tall buildings.
You can read CTBUH’s full report and explore the interactive timeline and map HERE >>
[Via CityLab]
RELATED: