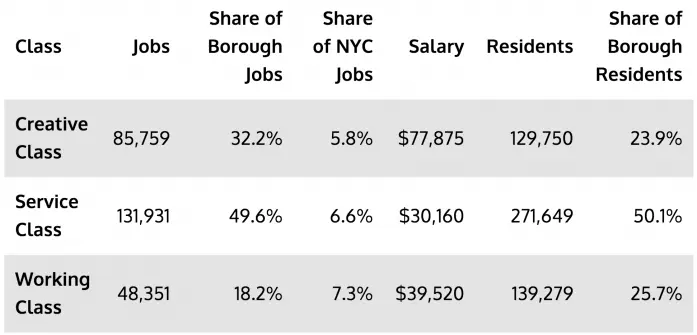
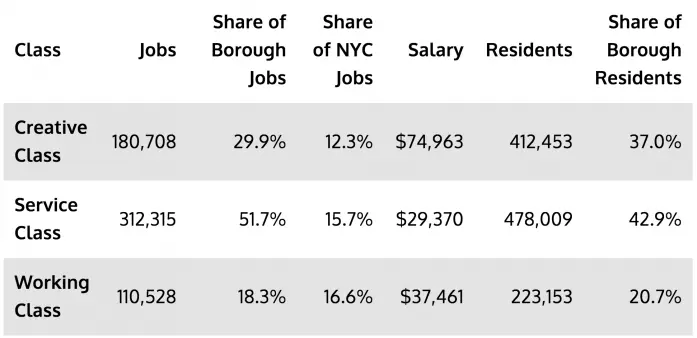
Outer borough creatives earn significantly less than their Manhattan counterparts

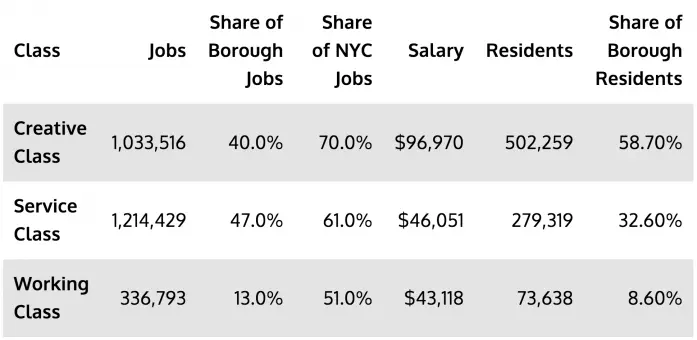
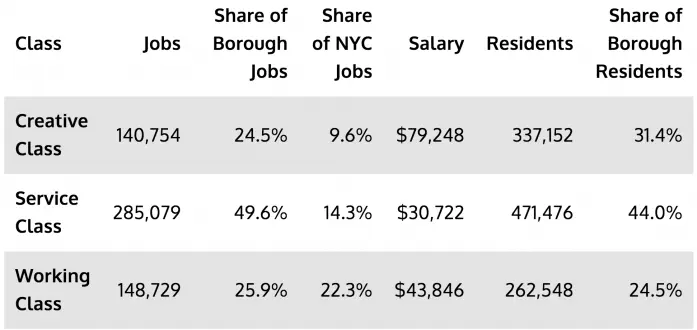
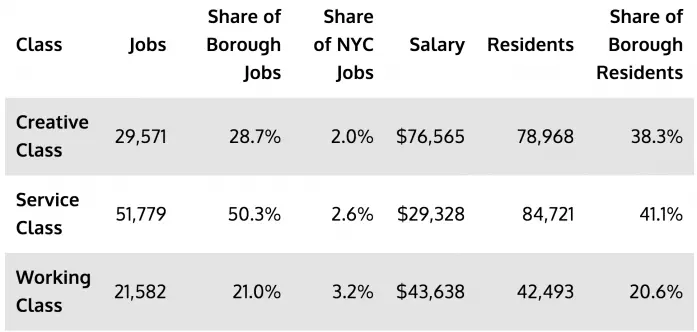
Data shows the borough in which you work could decide what income you bring home. CityLab looked at the city’s divided class structure in three main classes of employment–creative, service, and working–and in which borough these workers reside. The data shows that the creative class, made up of tech workers, artists, designers, and educational professionals, cluster in Manhattan, which employs nearly 70 percent of the city’s entire creative class. On top of that, clear income discrepancies exist among boroughs with the average salary for a creative class worker iat $96, 970 in Manhattan, $79,248 in Queens, $77,875 in the Bronx, and $76,565 in Staten Island. Surpisingly, Brooklyn’s creative class earns the least, with an average of $74,963.
 Manhattan
 Brooklyn
 Queens
 The Bronx
 Staten Island
Home to the most billionaires in the city, Manhattan remains the borough with the largest economy. Nearly half of the city’s blue-collar working class, 60 percent of its service class, and 70 percent of its creative class work in Manhattan. Since Manhattan maintains a monopoly on creative class jobs, the other four boroughs have less of these jobs available. Just 12 percent of creative class jobs can be found in Brooklyn, 9.6 percent in Queens, 5.8 percent in the Bronx, and only two percent in Staten Island.
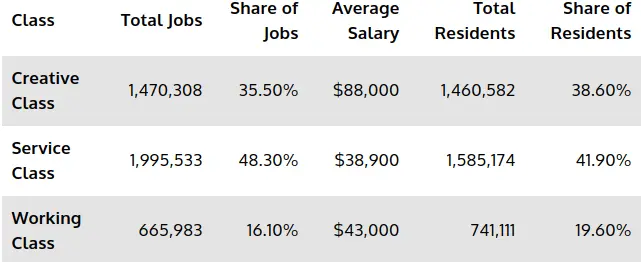
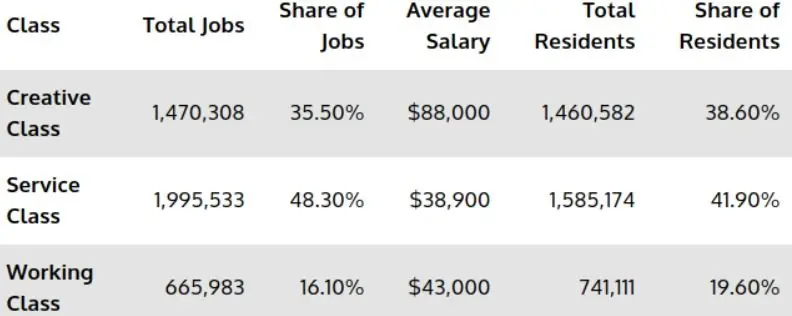
 This chart reflects citywide stats
Citywide, nearly 2 million people have service jobs, making up about 42 percent of its residents. While this class remains the largest, service workers make just $38,900 on average. Incomes reach below that in every borough: Brooklyn ($29,370), Queens ($30,722), the Bronx ($30,160) and Staten Island ($29,328). The working class, which makes more than service workers on average, continues to shrink, and only make up 16 percent of total jobs in the city.
As 6sqft previously reported, Manhattan has the highest concentration of wealth in NYC, with boundaries between wealthy and low-income areas constantly in flux due to gentrification. The data also reinforces the idea of Manhattan as the center of high-end job employment and wealth.
[Via CityLab]
RELATED:
- Interactive map reveals the income gap that divides NYC’s richest and poorest
- NYC Is Home to 79 Billionaires, More Than Any City in the World
- Study Finds Widening Life Expectancy Gap Between Rich and Poor Americans
All charts courtesy of CityLab, data via U.S. Bureau of Labor Statistics and 2015 American Community Survey