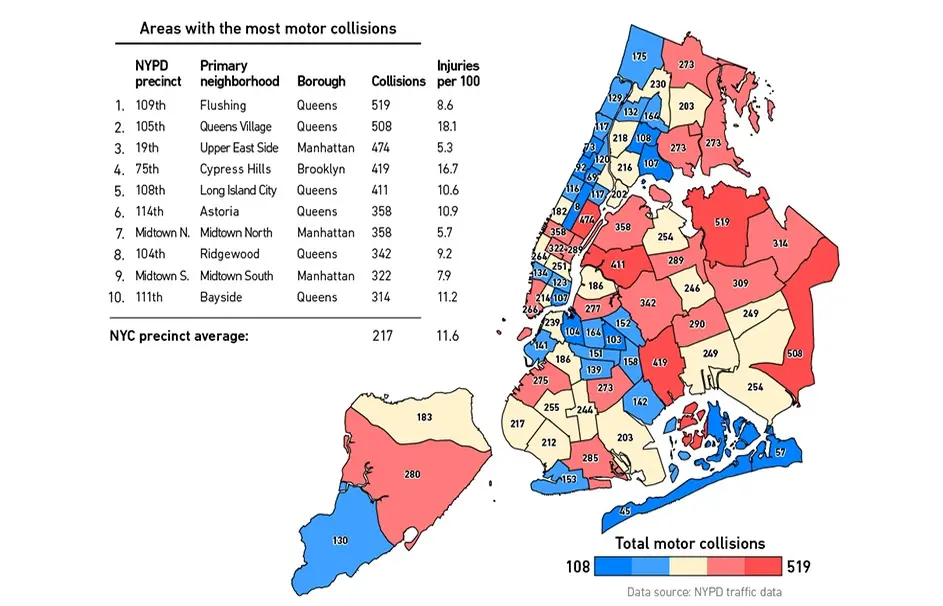
Flushing and the Upper East Side Top the List of Most Traffic Accidents in NYC

Between March 2014 and April 2015, the city reported 223,141 motor vehicle accidents, almost 25 percent of which resulted in injury or death. The Auto Insurance Center used this open-source data, which includes geographical coordinates for the accidents, to create maps and graphs examining where and when the collisions happened (h/t Brokelyn). Queens accounted for 29.5 percent of the total collisions, with Brooklyn coming in right behind at 28 percent. In terms of neighborhoods (broken down by police precincts), Flushing, Queens takes the top spot, followed by Queens Village, the Upper East Side, Cypress Hills, Brooklyn, and Long Island City, respectively.
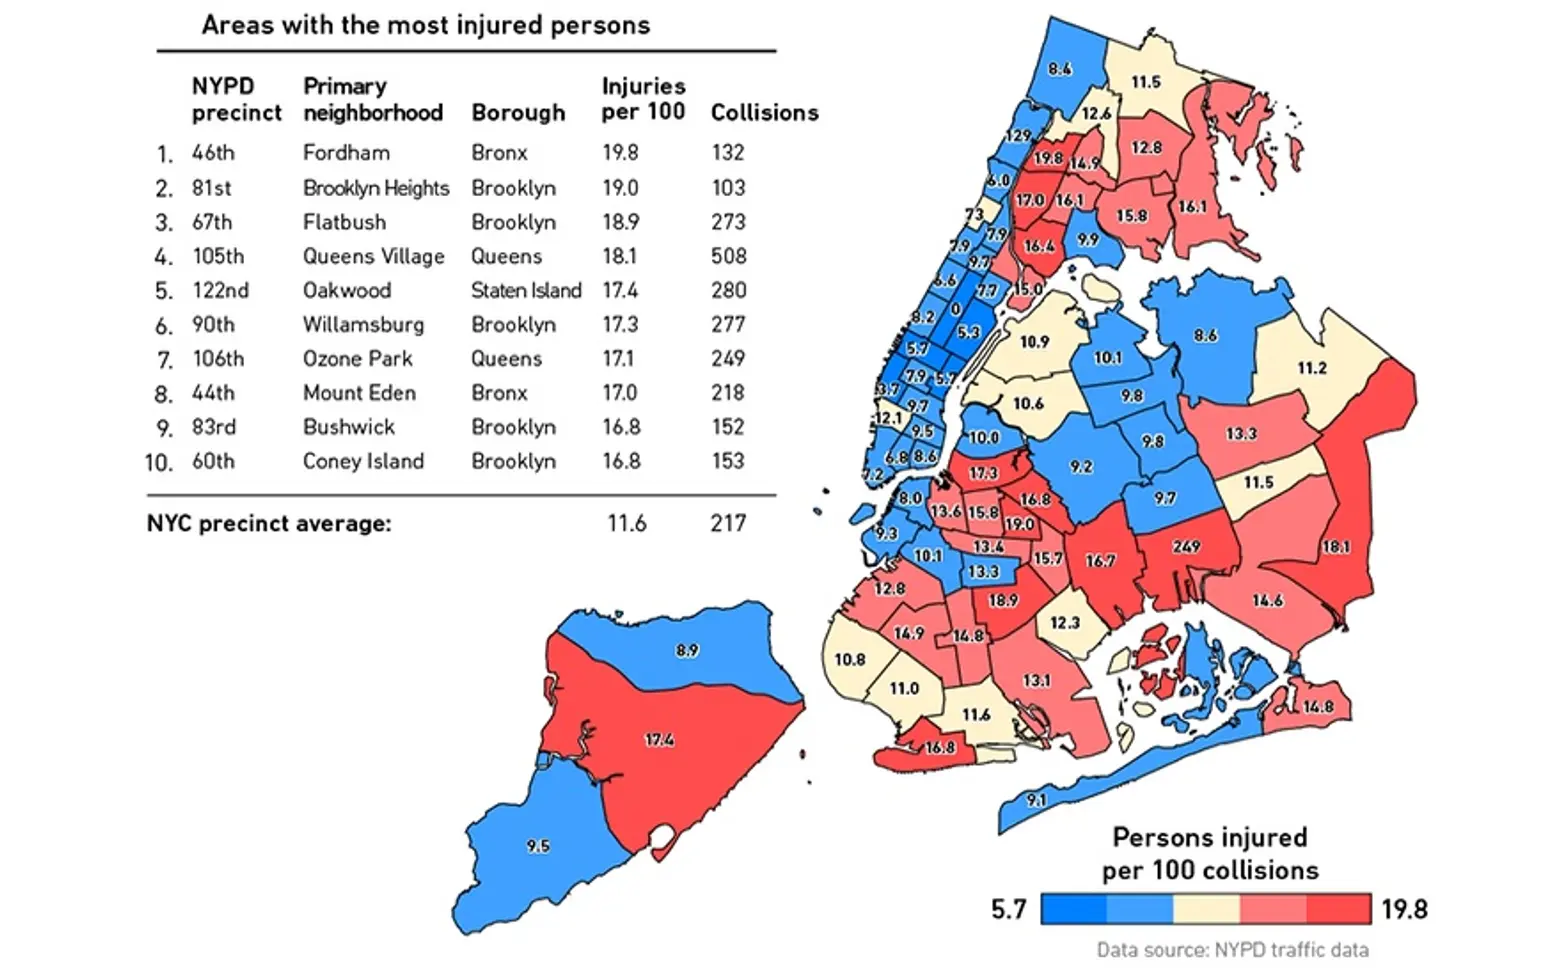

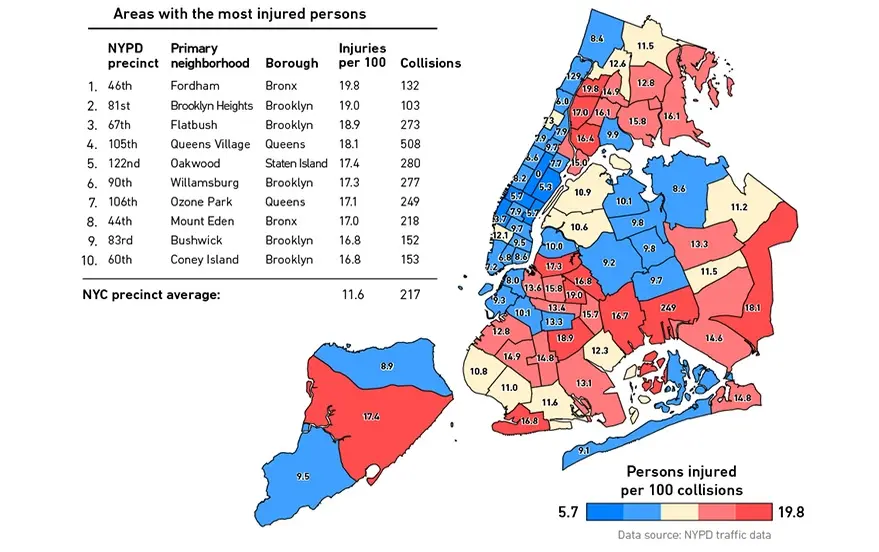
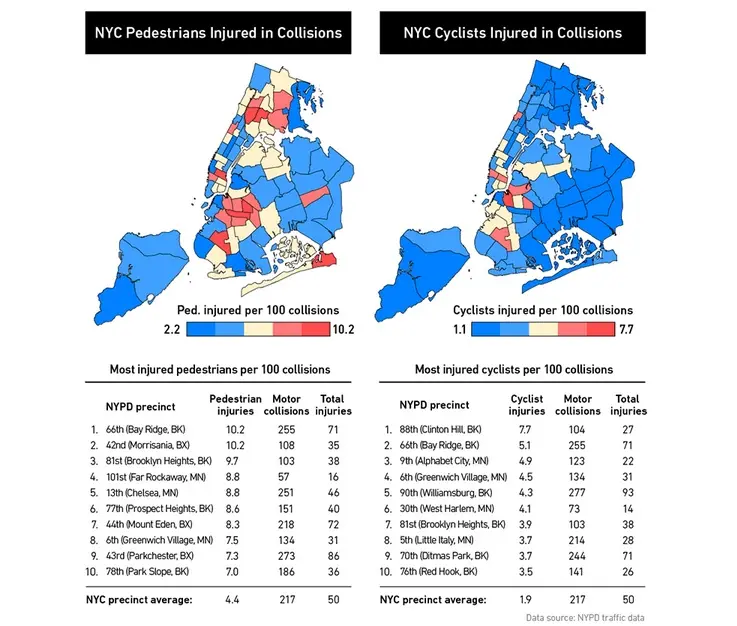
Looking at injuries from collisions, however, Fordham Heights in the Bronx had the most with 19.8 injuries per 100 collisions. Coming in next are Brooklyn Heights and Flatbush in Brooklyn and Queens Village. The most pedestrian injuries occurred in Borough Park, Brooklyn (the map incorrectly labels the 66th precinct as Bay Ridge) and the most cyclist injuries (77.5 percent of which result in injury) in Clinton Hill. Not surprisingly, the top ten neighborhoods with the most collisions caused by taxis are all in Manhattan, with the Upper East Side, Midtown, Chelsea, and Murray Hill having the greatest numbers. Also not surprisingly, most accidents take place during rush hour and around 3:00pm, when schools let out.
Take a look at all the maps and data here.
All data via NYPD; Maps via Auto Insurance Center
RELATED: