City releases map with all of the affordable housing units created or preserved since 2014

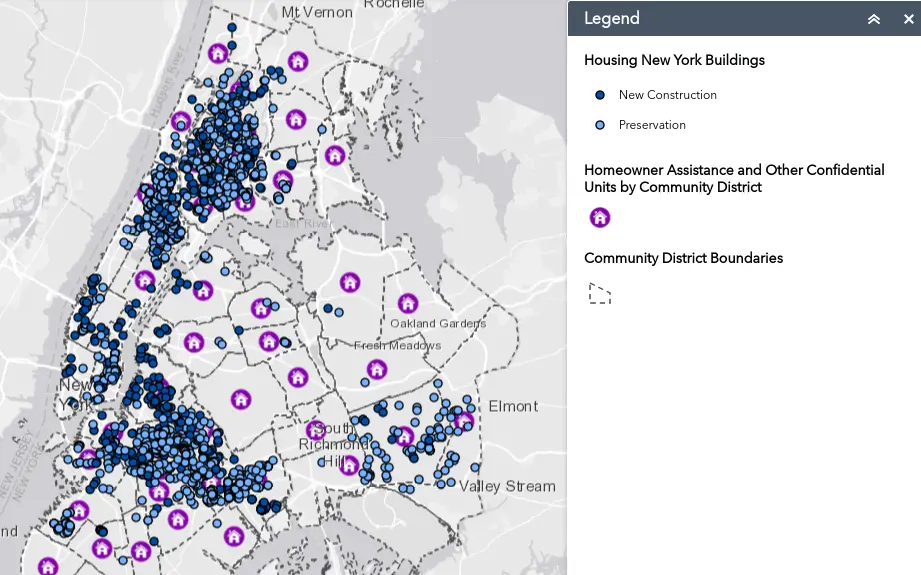
In addition to upping the number of affordable housing units created or preserved in New York City, Mayor Bill de Blasio is pushing for greater transparency of his ambitious plan to bring 300,000 affordable units to the city by 2026. The Department of Housing Preservation and Development (HPD) launched an interactive map on Monday that displays all of the units, buildings, and projects that count towards the mayor’s Housing New York 2.0 plan (h/t Curbed NY). The counted units, with data starting with units from January 1, 2014 on and will be updated quarterly, are shown by the number of units and occupancy size.
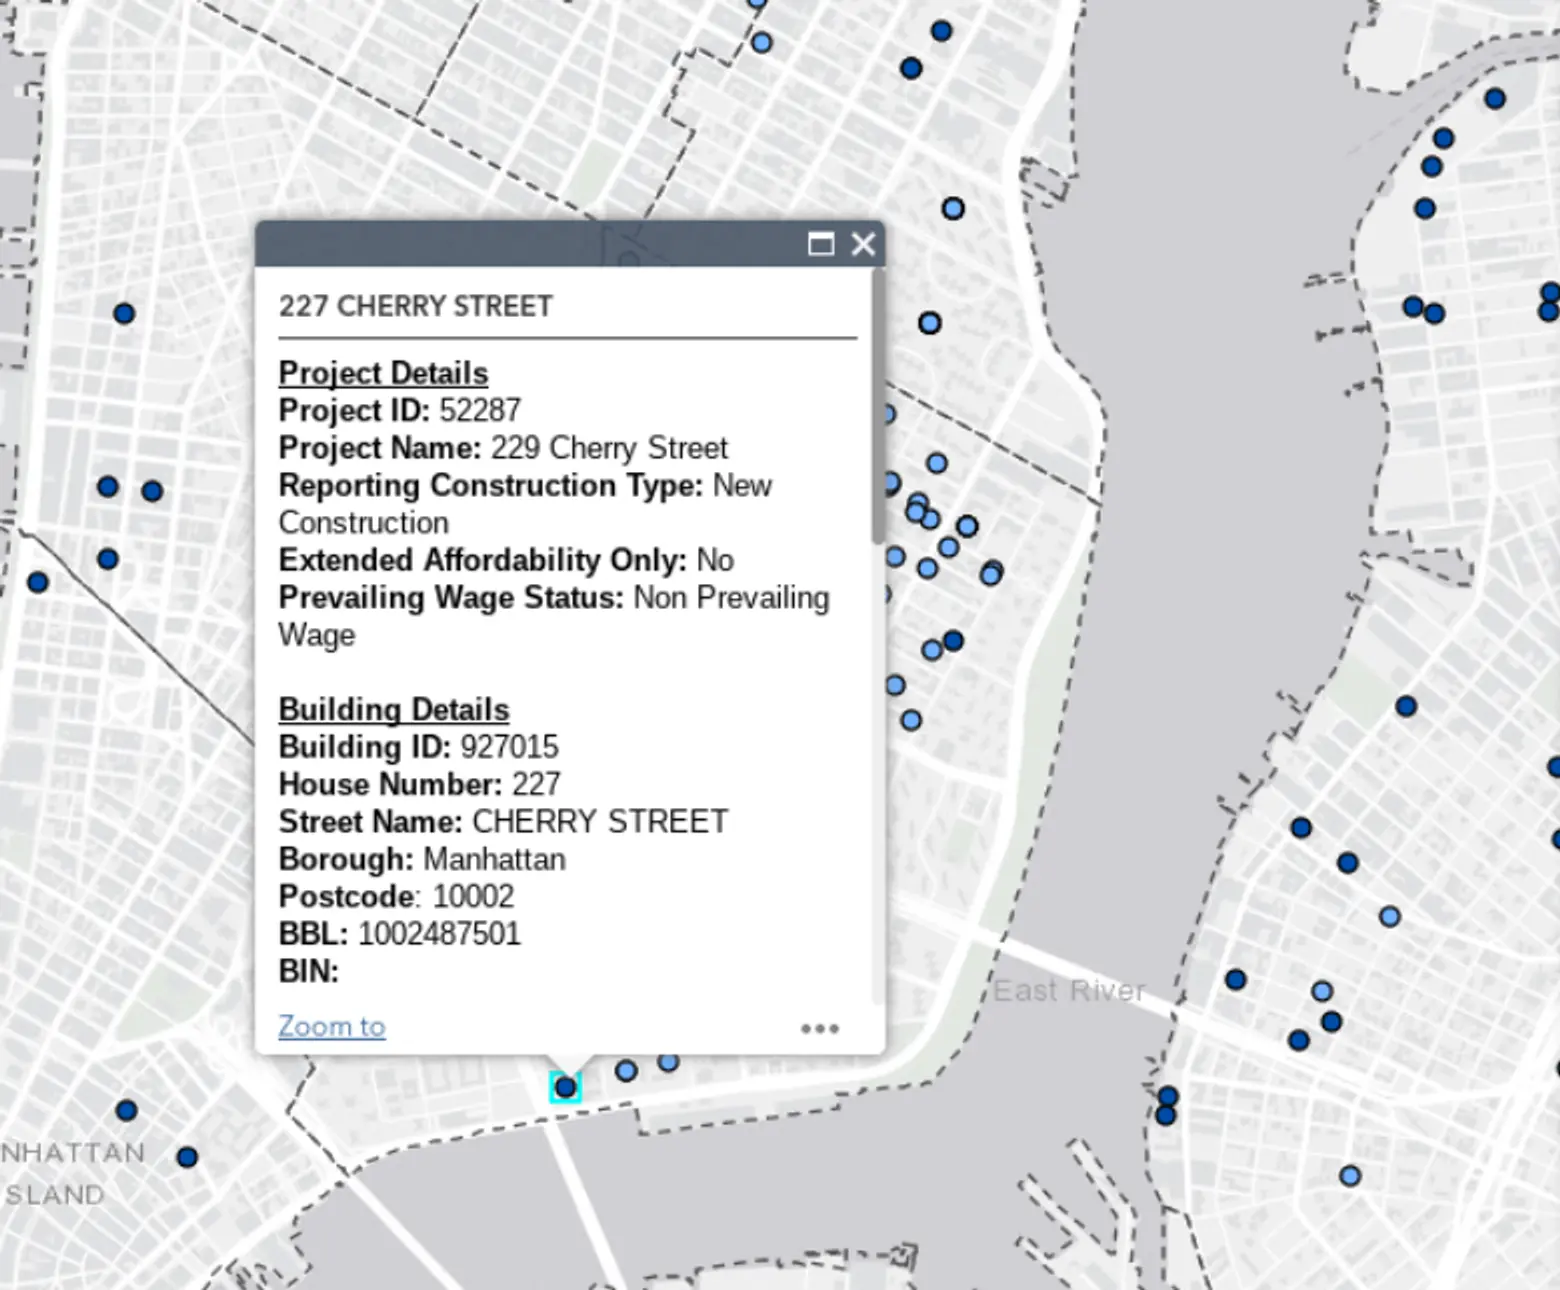
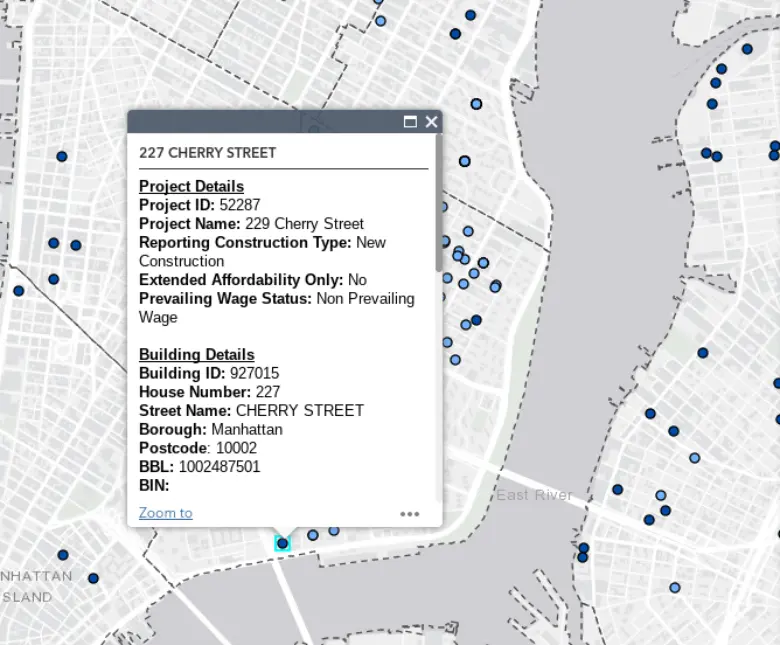
Extell’s 800-foot-tall One Manhattan Square will rise at 250 South Street (formerly 227 Cherry Street); The map says 204 low-income units are expected
The dark blue dots on the map represent “new construction” of Housing New York buildings and the lighter blue dots are affordable units or projects that have been preserved. Certain types of projects are labeled with a purple-house icon on the map, considered a “Homeowner Assistance and Other Confidential Units by Community District.” This means the homeowners’ identities are protected.
Last October, de Blasio unveiled his Housing New York 2.0 plan, which set a new goal of 300,000 new or preserved affordable housing units by 2026, an increase of 100,000 from the city’s original goal.
And last month, the city set a record in 2017 for the highest number of affordable homes financed in three decades: 24,500. Over the past four years, the de Blasio administration has created or preserved more than 87,500 affordable units.
Explore HPD’s affordable housing map here.
[Via Curbed NY]
RELATED: