Watch New York City Get Blown Up With the ‘Every Demolition in Manhattan’ Map

A animated sample of the Every Demolition in Manhattan map, click ahead for a more detailed view
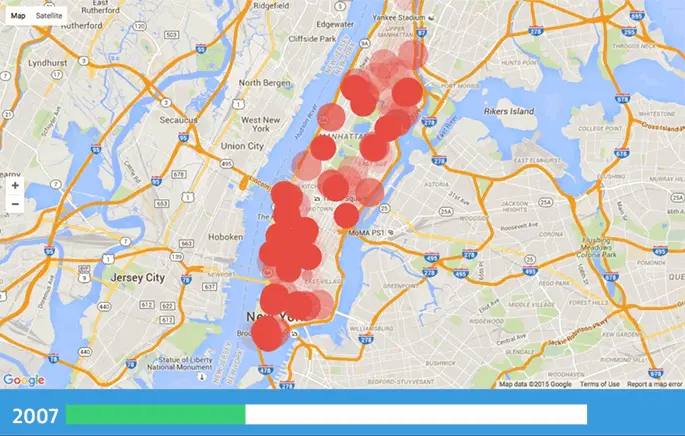
You’ve surely realized by now that New York is in the midst of a building boom, but if all the cranes and scaffolding rising from the ground aren’t enough convince you that you’re living in a pretty historic moment, look no further than this incredible map to put all that construction in perspective. Called Every Demolition in Manhattan, this animated survey tracks every demolition that’s taken place in the city from 2003 through 2014.
Using data culled from the Department of Buildings, each demo is marked using Google Maps API circle object, a feature which allows a user (in this case, the map’s creator Address Report) to adjust the opacity of each circle. Applied to this particular map, what’s produced is a pretty spectacular and fitting visual effect.

The most impressive moments are seen around 2007-2008, just before the financial crisis, and of course when you hit 2013-2014—both points where the entire island seems to explode into a mushroom cloud of red. If the data were to include 2015 activity and Brooklyn, one could expect to see an even bigger blanket effect. As 6sqft previously reported in August, building permits were up 156 percent over the last year with 42,088 new permits issued to residential developers. The figure is higher than anything seen since 1963, and Brooklyn accounted for more than half that.
Happy building, New York!
GET THE FULL SIZE DETAILED VIEW HERE >>
RELATED:


Get Inspired by NYC.
Leave a reply
Your email address will not be published.


Can the map be enlarged? It just looks like a blur of red dots.
A new representation of Manhattan through its building height in a topographic design.
http://www.vividmaps.com/2016/04/if-manhattan-was-mountain.html