New Map Shows Where More Than 50,000 Rent Stabilized Apartments Have Been Lost

At the end of last month, the Rent Guidelines Board voted to freeze rents for the first time on one-year leases for the city’s more than one million rent stabilized apartments, which make up about 47% of the city’s total rental units. They also increased rents on two-year leases by only two percent, the lowest in the board’s 46 years. While this historic ruling is a huge win for tenants, it doesn’t bring back the astonishing number of apartments that have been deregulated. Since 1994, nearly 250,000 units have lost rent regulation protections, and over these past eight years alone, New York City has lost more than 50,000 rent stabilized apartments.
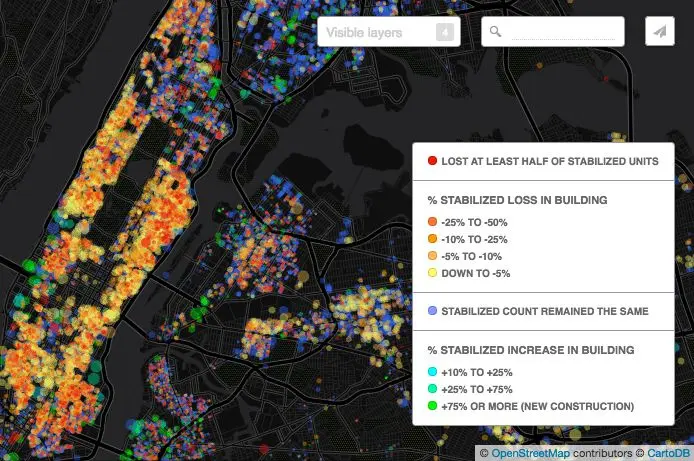
To put that staggering number into perspective, cartographer John Krauss has put together a handy map that shows where all of these 50,000 apartments are located (h/t Gothamist). Using scraped tax bills, he plotted changes in the number of rent-stabilized units, building by building.
How can an apartment be deregulated? We explored this in an earlier piece: “Generally the only way an apartment can become deregulated when a tenant is in residence is if it reaches the $2,500 level and that tenant’s income is $200,000 or more and has been in excess of $200,000 for two years. In some cases, 421-a and J-51 tax abatement buildings may become deregulated at the end of the last lease commencing during the period of the tax abatement.”
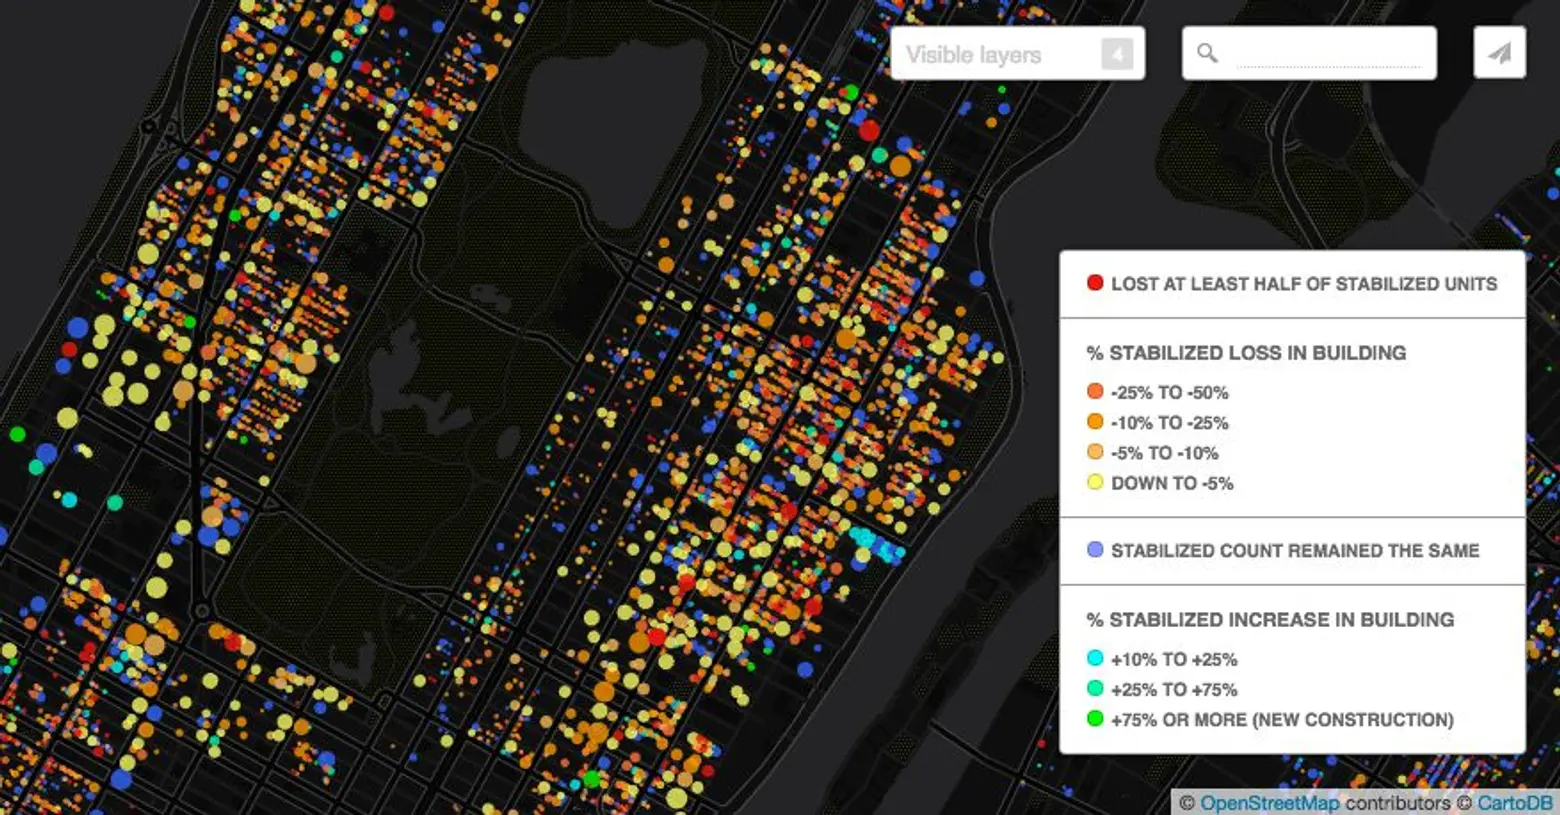
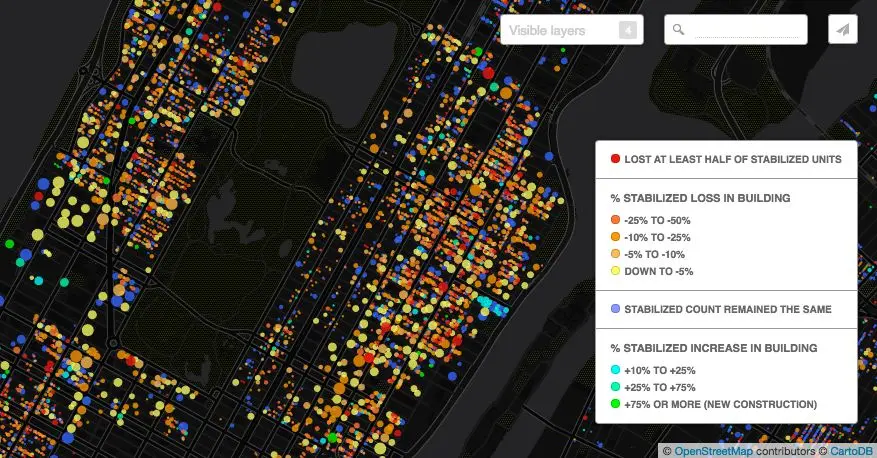
Close up of the Upper East Side
Those buildings in red on the map have lost at least half of their stabilized units since 2007. It then goes down in percentage from orange to yellow. Blue buildings had their stabilization count remain the same or increase, and green locations, which include new construction, saw a 75 percent increase in stabilized units. Gothamist notes that Manhattan saw the most deregulation, with the Upper East Side and East Village/Lower East Side coming in on top. Places like Stuyvesant Town (due to a 2009 court ruling that reregulated more than 3,000 apartments) and the new buildings west of Penn Station (which received tax breaks for including affordable housing) are on the blue/green spectrum. In the outer boroughs, red patches can be seen in Downtown Brooklyn, Park Slope, Crown Heights, Williamsburg, Greenpoint, Bushwick, Astoria, and Long Island City.
Curious about your neighborhood? Explore the full interactive map here.
[Via Gothamist]
RELATED:
- Rent Guidelines Board Approves Freezes on One-Year Leases for First Time in History
- Rent Stabilization Demystified: Know the Rules, Your Rights, and if You’re Getting Cheated
- City Council Announces New Task Force on Tracking and Preserving Affordable Housing
- New Map Plots Every Airbnb Listing in NYC